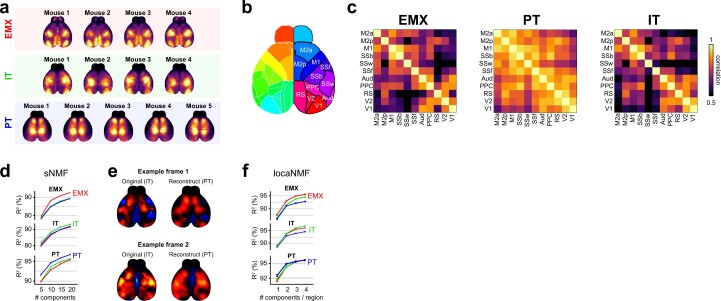
Extended Data Fig. 1. Pyn-specific cortical maps of total variance and inter-regional correlations.
(a) Maps of variance over all frames for individual mice in each PyN type group. Colors are normalized between zero and the 95th percentile for each animal. Distinct variance patterns for each PyN type were largely conserved across individual mice. (b) Map of cortical regions, used for correlation analysis. V1 = primary visual cortex, V2 = secondary visual cortex, RS = retrosplenial cortex, Aud = auditory cortex, PPC = posterior parietal cortex, SSw = somatosensory whisker area, SSb = somatosensory body area, SSf = somatosensory face area, M1 = primary motor cortex, M2p = posterior secondary motor cortex, M2a = anterior secondary motor cortex. (c) Correlations between cortical regions in EMX, PT and IT neurons averaged over all sessions and mice. Inter-region correlations were comparable between EMX and IT neurons but overall increased for PT neurons. (d) R2 of EMX, IT and PT reconstructions (top to bottom panels), using components from different PyN types (red, green, and blue traces). For within-group reconstructions, only components from other mice were used. (e) Single-frame reconstructions of IT data, using PT components. IT imaging data (original) was projected onto PT components to assess if they would be applicable to capture IT variance. While the reconstruction captured a large fraction of variance (~93%, Supplementary Video 4, comparing individual frames showed that PT components did not recreate more fine-grained spatial features of the IT data. (f) R2 of EMX, IT and PT reconstructions, using locaNMF components from different PyN types (formatting as in panel a)). Shown are results for different number of components per region, using 24 regions in total. The minimum number of components was therefore 24 (1 component per region) and the maximum 96 (4 components per region).

