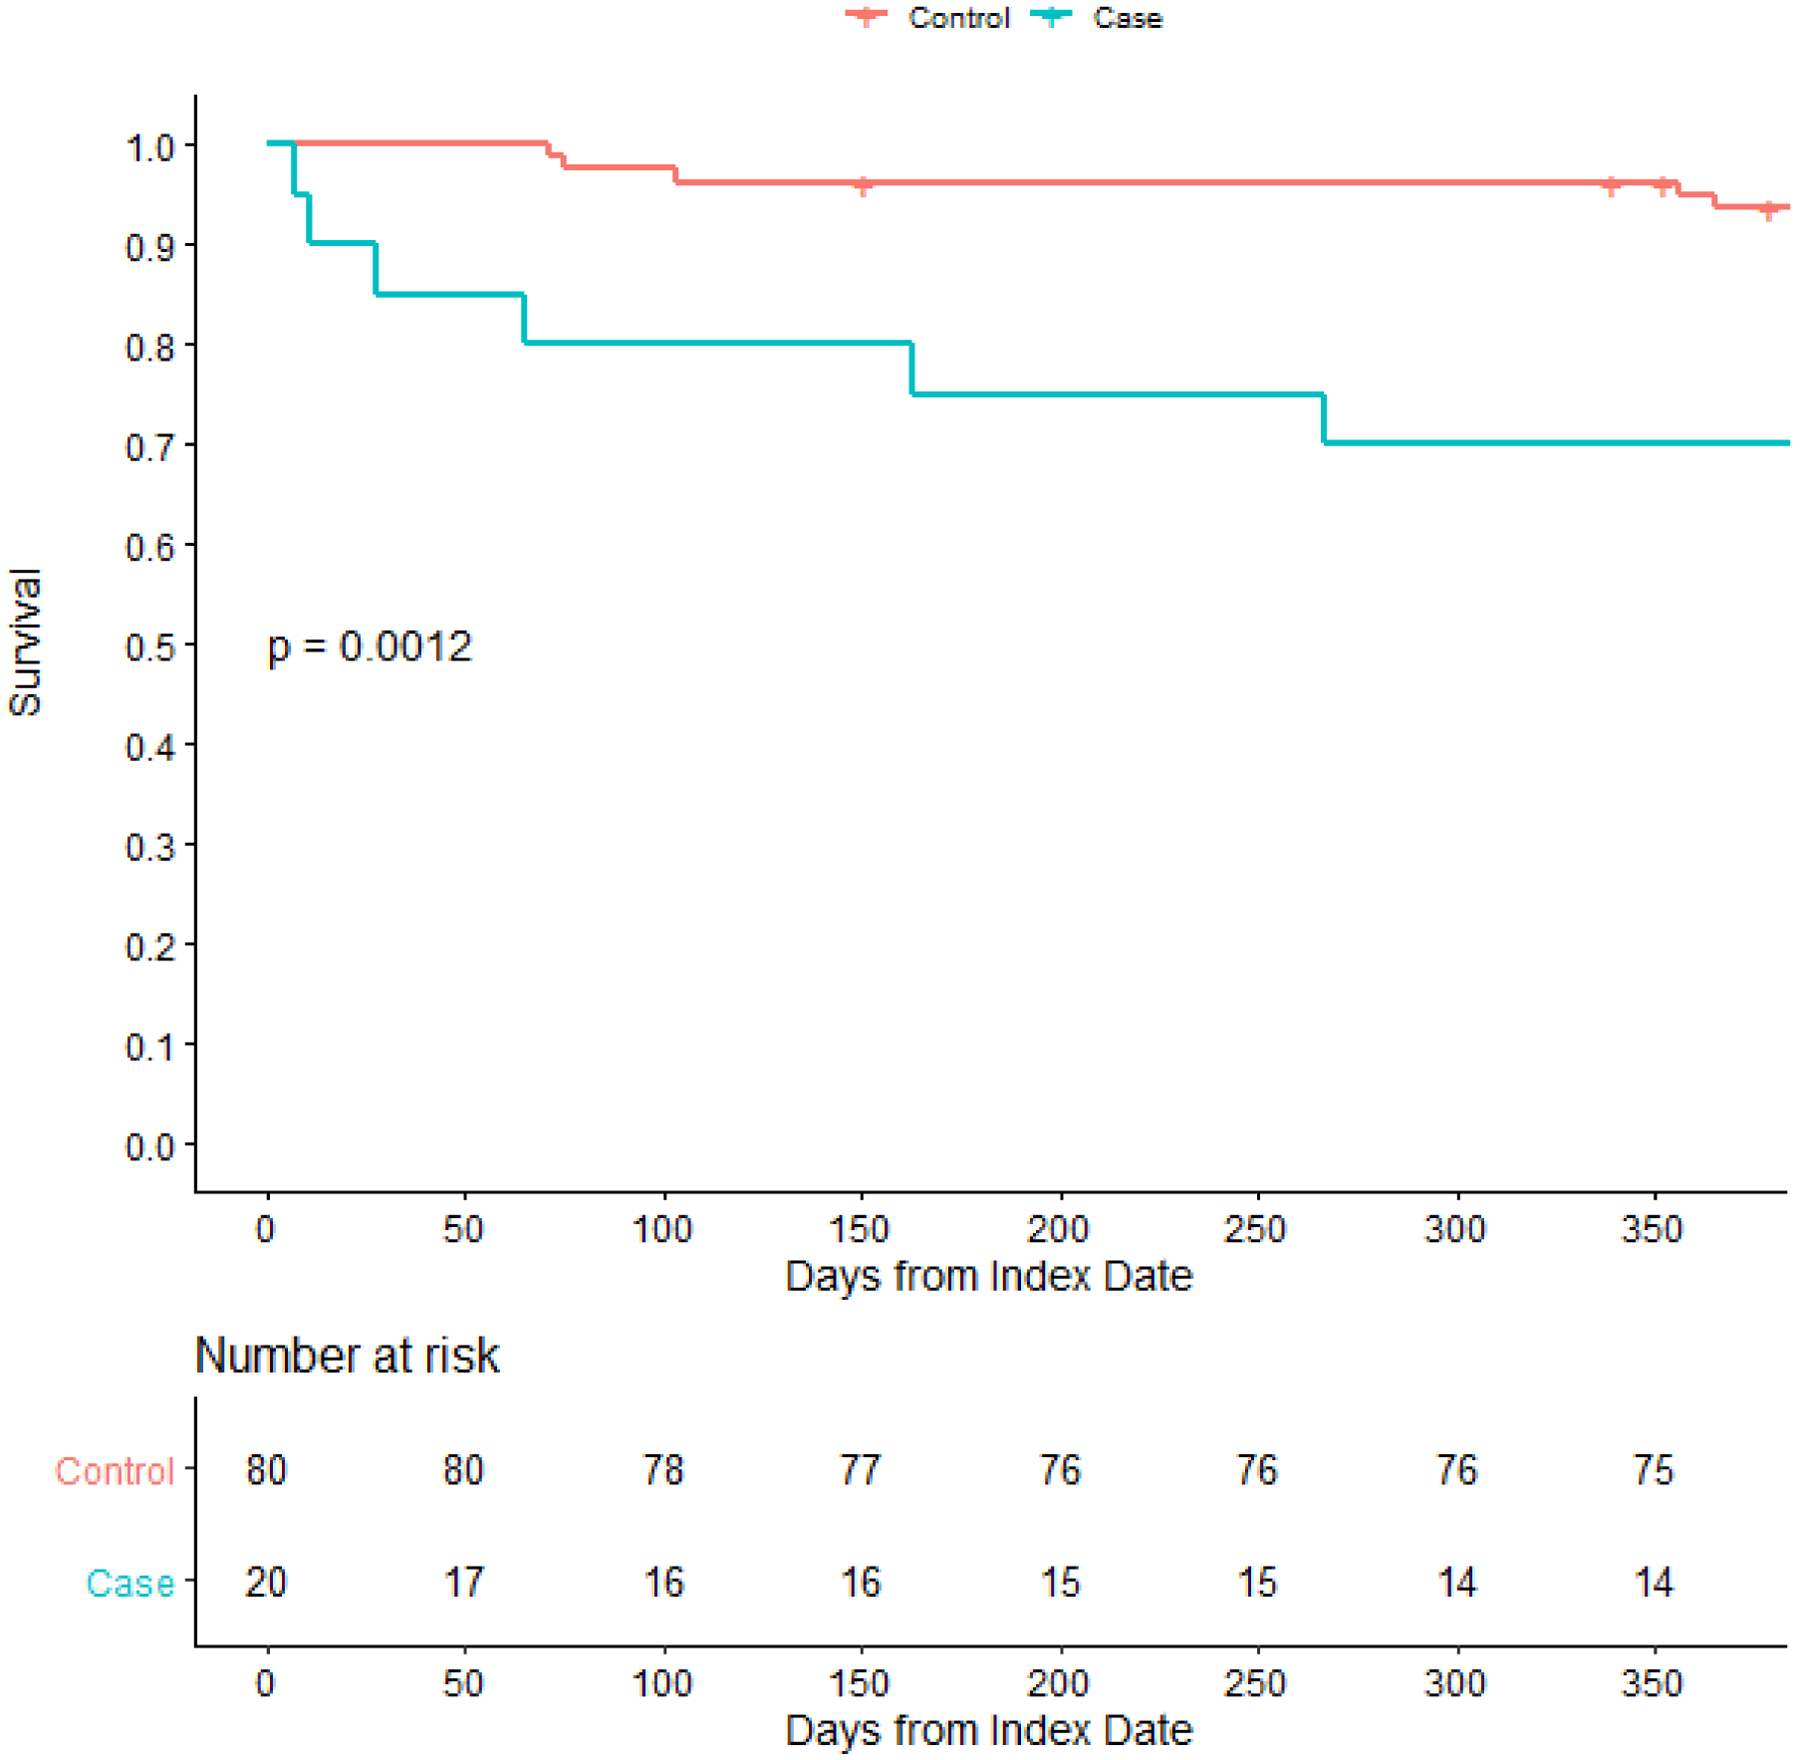
Figure 2:

Kaplan-Meier curve comparing survival following diagnosis or matched date of follow-up between allogeneic hematopoietic stem cell transplant recipients with or without nocardiosis. The dashed lines on the Kaplan-Meier curve indicate a censored patient. The p-value is calculated via the log-rank test.
