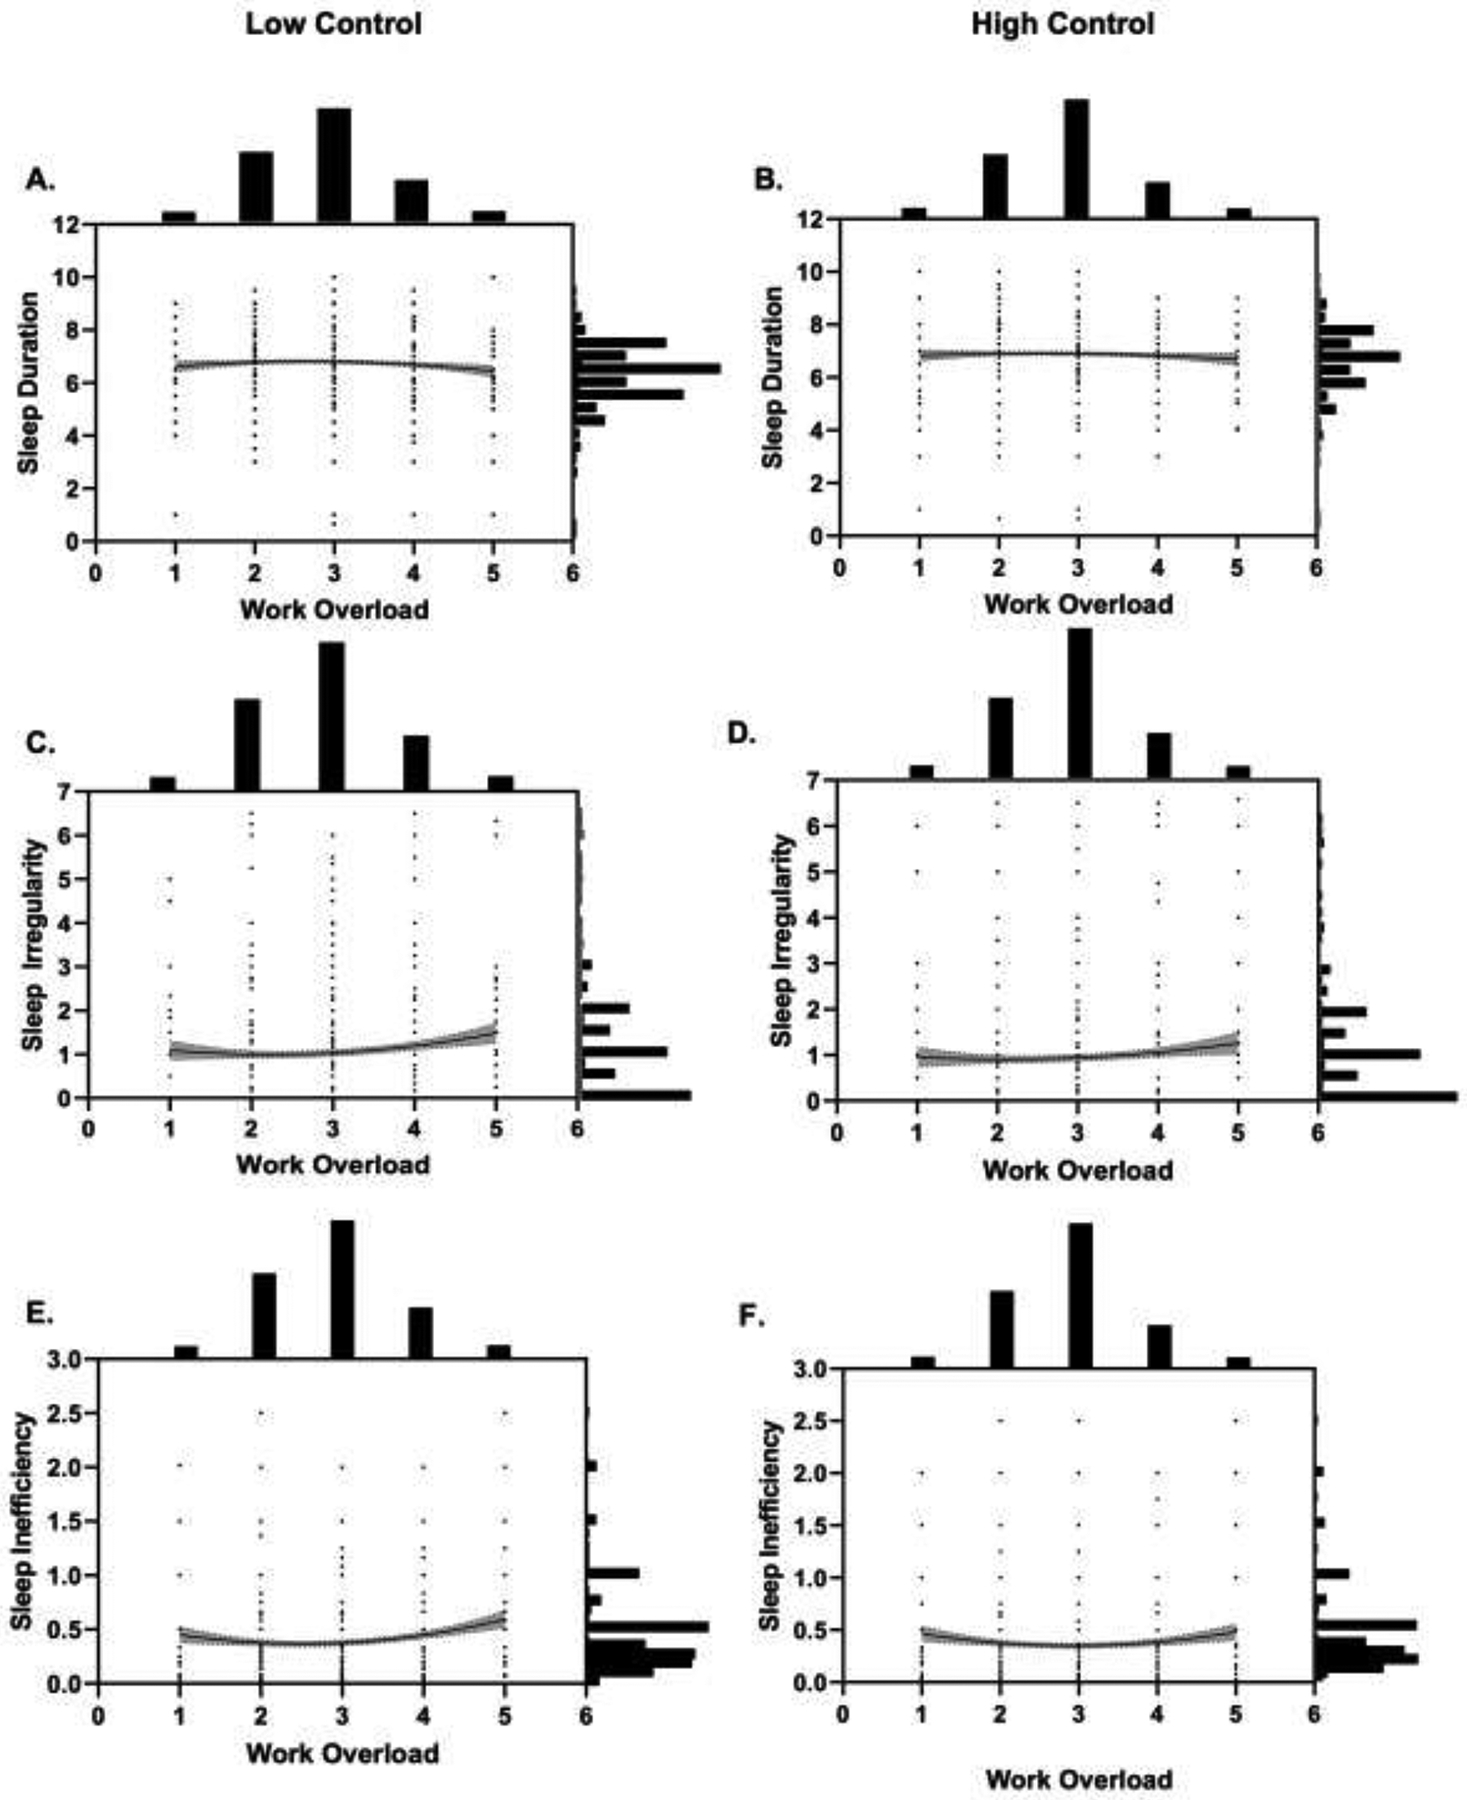
Figure 2.

Curvilinear Relationships Between Work Overload and Sleep Health Dimensions Stratified by Job Control. Work overload (M=2.89) was mean centered for analyses. Work overload represents the frequency (1=never, 2=little of the time, 3=some of the time, 4=most of the time, 5=all of the time) with which participants had too many demands made on them. Lower values on sleep duration represent poorer sleep (Panels A and B) whereas higher values on sleep irregularity and sleep inefficiency represent poorer sleep (Panels C-F). Analyses were stratified by job control (left: low control; right: high control). All figures include bar graphs with frequency (%) of responses for sleep health (right) and work overload (top). A scatterplot represents the responses participants provided. Shaded regions represent 95% confidence intervals. Significant quadratic relationships exist between work overload and sleep duration (A: low control), sleep irregularity (C: low control), and sleep inefficiency (E: low control; F: high control). Moderate demands were associated with longer sleep duration, and more regular and efficient sleep. Relationships between work overload, sleep duration, and sleep irregularity were non-significant for participants with high job control. There were no significant quadratic relationships between work overload and either nap frequency or sleep dissatisfaction. There were also no other significant quadratic effects of the remaining job demands indicators for any of the sleep health dimensions in stratified analyses.
