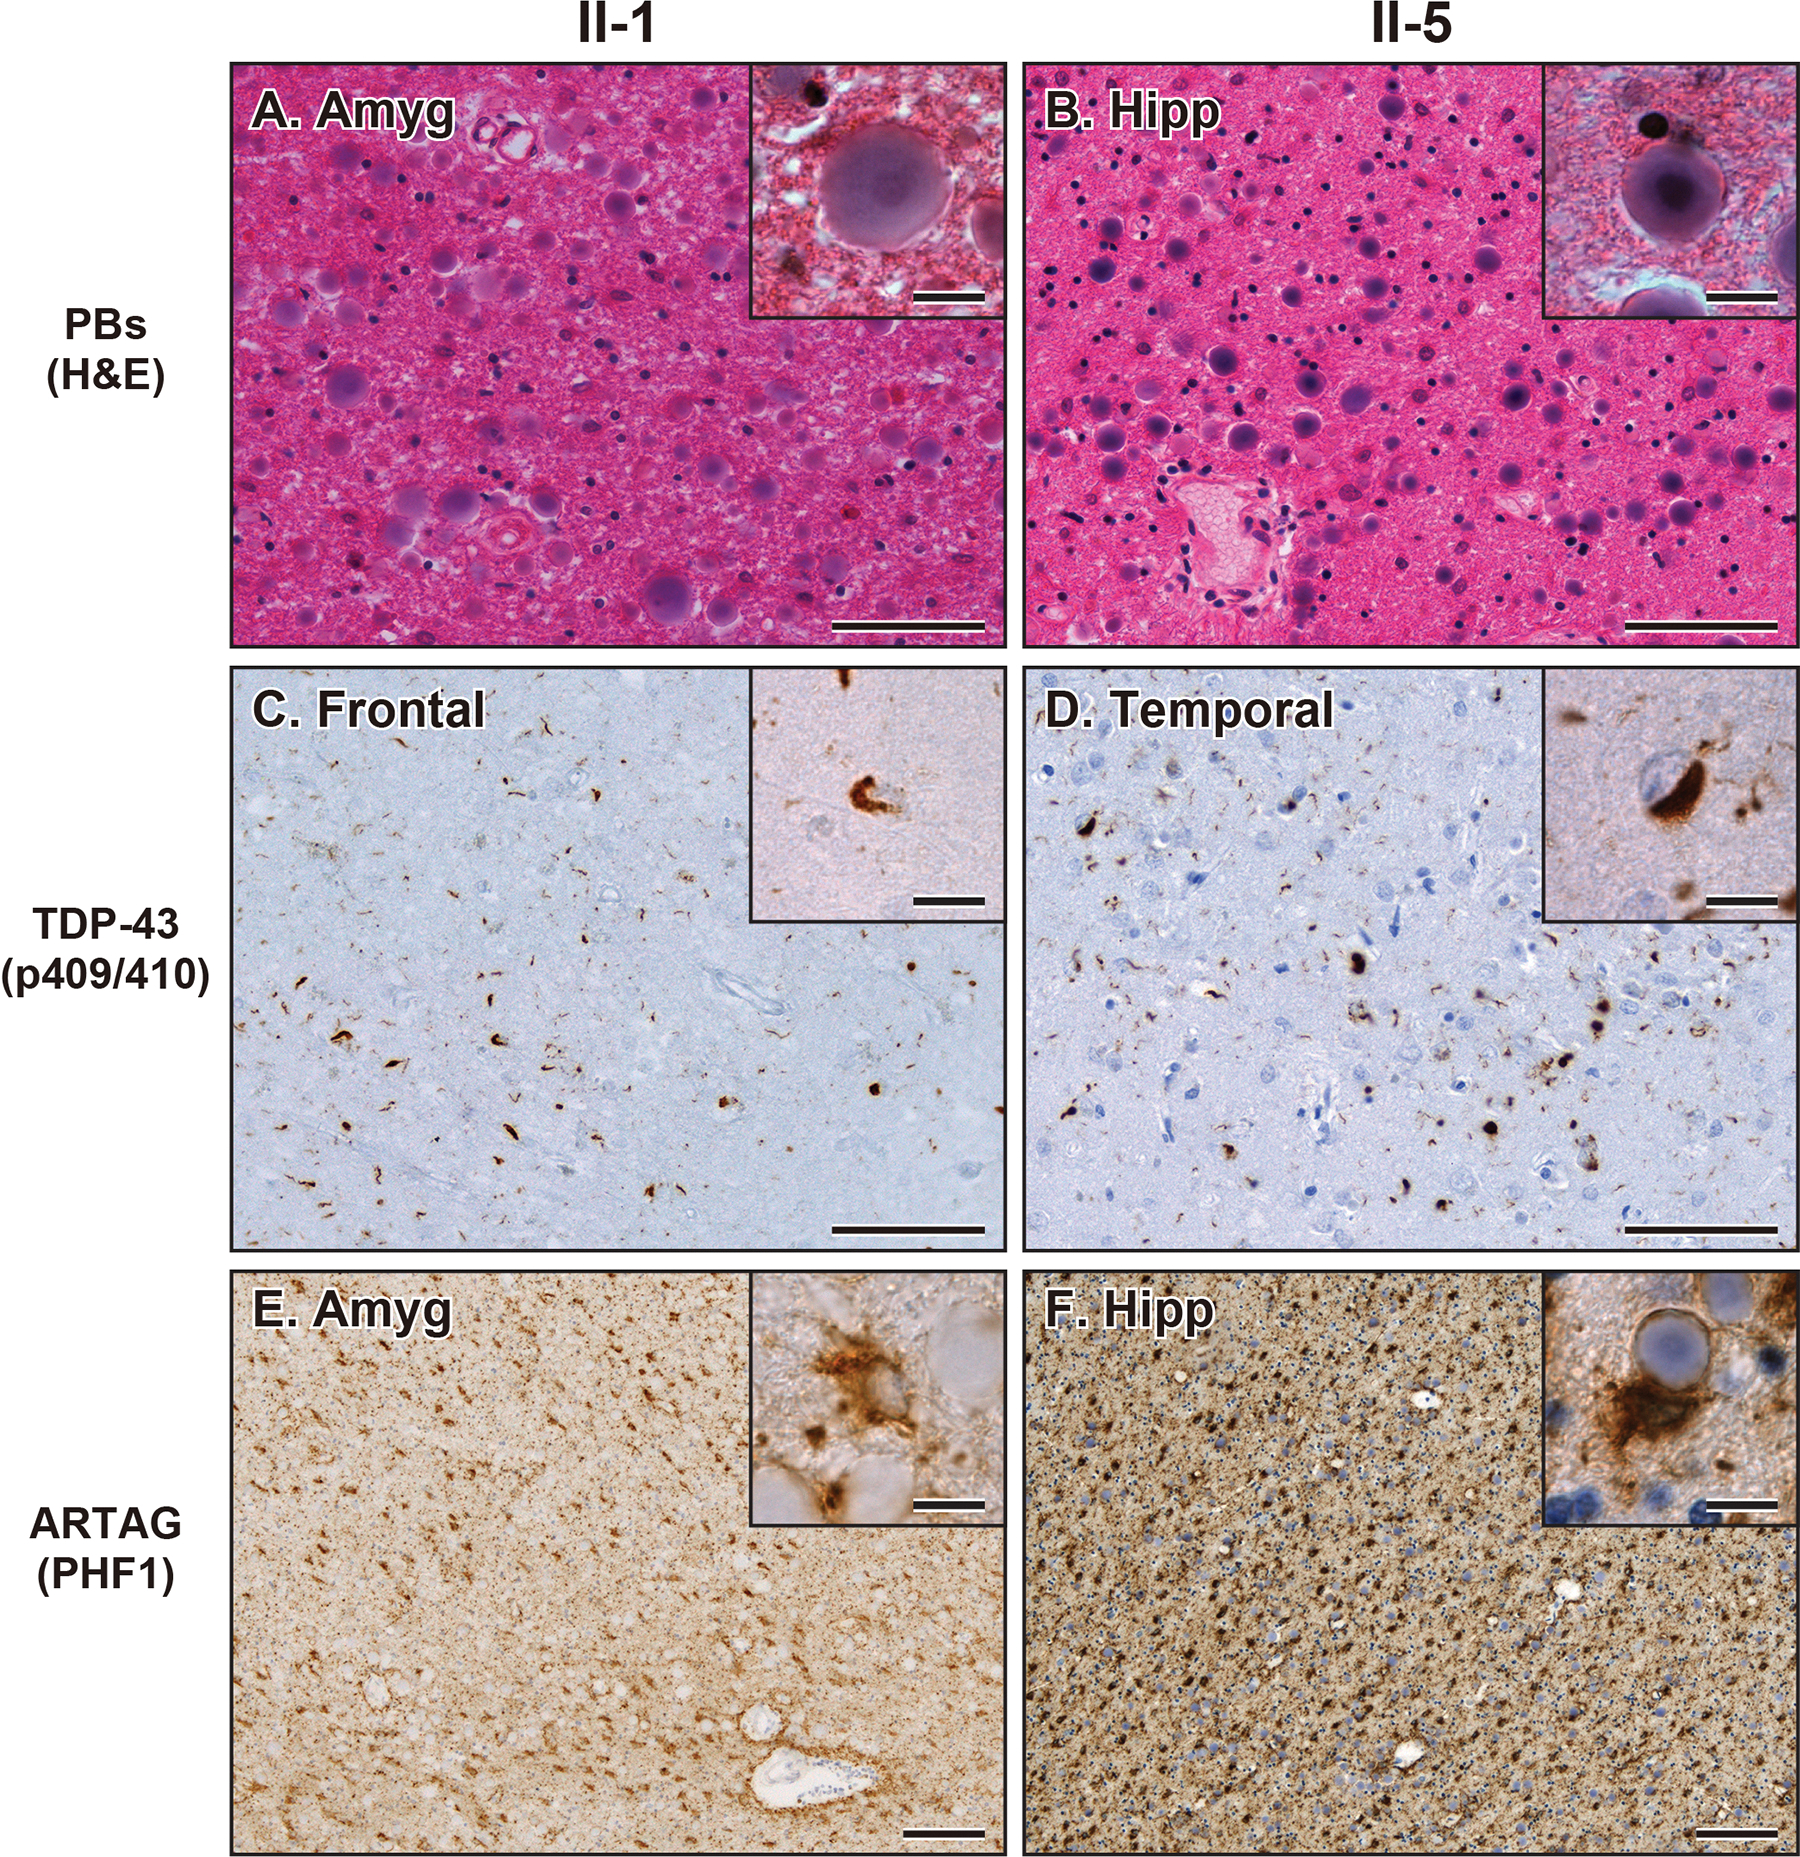
Figure 3. Neuropathological findings in the cases with GBE1 mutation.

(A, B) Representative images of H&E staining showing PBs in the amygdala in case II-1 (A) and hippocampus in case II-5 (B). Bars represent 50 μm and 10 μm (insets). (C, D) Representative images of TDP-43 (p409/410) staining showing NCI and DN in the frontal cortex in case II-1 (C) and temporal cortex in case II-5 (D). Bars represent 50 μm and 10 μm (insets). (E, F) Representative images of PHF1 staining showing ARTAG in the amygdala in case II-1 (E) and hippocampus in case II-5 (F). Insets show PBs adjacent to ARTAG. Bars represent 200 μm and 10 μm (insets). Abbreviations: Amyg, amygdala; Hipp, hippocampus; Temp, temporal cortex.
