
Figure 4. Distribution of PBs, TDP-43 NCI and DN, and ARTAG in the CNS with GBE1 mutation.
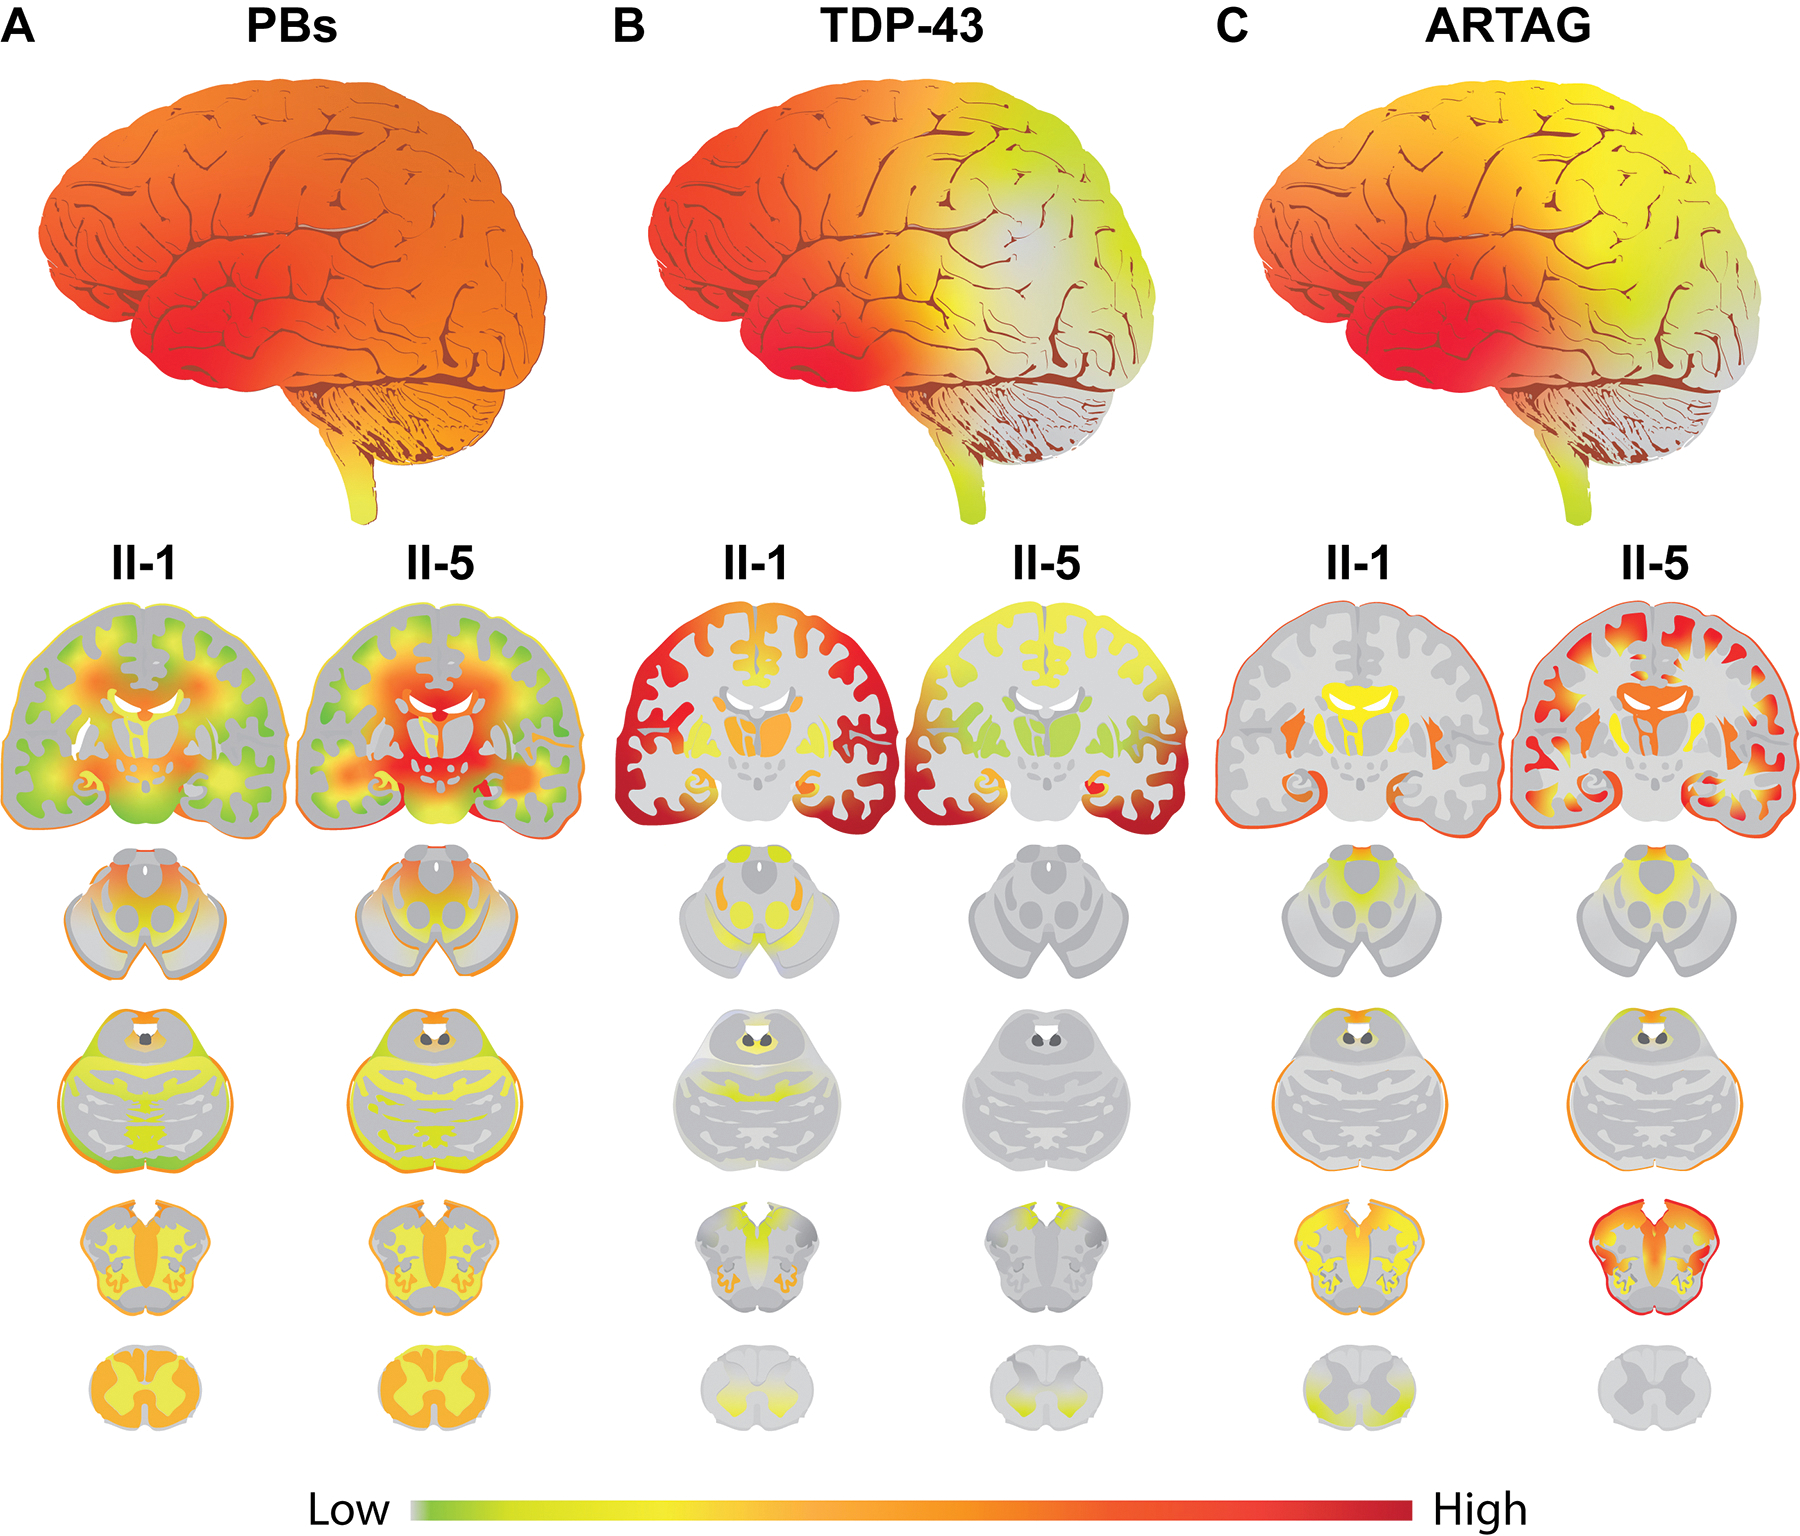
(A) Heatmap of PB pathology. The upper whole brain image represents the average of two cases with interpolated smoothing. Lower sagittal and coronal images represent PB distribution in II-1 and II-5. PBs are observed in the subpial matter and the deep white matter of frontal, temporal, parietal, and occipital lobes, and the cerebellum as well as some parts of the brainstem and the spinal cord. II-5 shows more abundant PB pathology than II-1. (B) Heatmap of TDP-43 pathology. The upper whole brain image represents the average of two cases with interpolated smoothing. Lower sagittal and coronal images represent TDP-43 distribution in II-1 and II-5. TDP-43 NCI and DN are observed in the neocortical, allocortical, and subcortical grey matter and partially in the grey matter of the brainstem and spinal cord. The TDP-43 pathologies are especially abundant in the frontotemporal cortices. II-1 shows more broadly distributed pathology than II-5. (C) Heatmap of ARTAG pathology. The upper whole brain image represents the average of two cases with interpolated smoothing. Lower sagittal and coronal images represent ARTAG distribution in II-1 and II-5. ARTAG is abundantly observed in the subpial matter and the white matter of frontotemporal lobes, amygdala, and hippocampus and partially observed in the subpial matter and the white matter of the brainstem and spinal cord. II-5 shows more abundant and broadly distributed ARTAG than II-1. A gradient smoothing method was used for the boundaries between each assessed legion.