Figure 2.
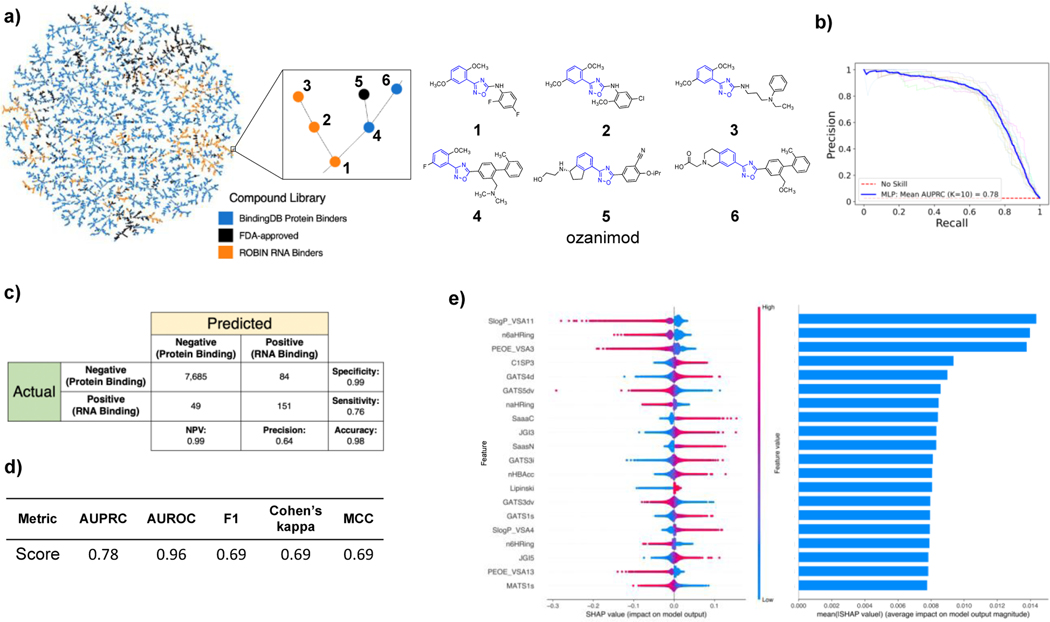
Classification of ROBIN RNA binders and protein binders. A) Left, TMAP of 10,000 BindingDB protein binders (blue), 2,350 FDA-approved drugs (black), and 2,003 ROBIN RNA binders (orange) encoded with ECFP4 fingerprints. Right, six structures shown from a detail of the TMAP illustrating related molecules on a branch. The blue part of the structures demonstrates the common core shared by the molecules on the branch. B) Precision recall (PR) curve for classification of augmented ROBIN RNA binders and BindingDB protein binders using the multi-layer perceptron (MLP) model. C) Confusion matrix showing the performance of the MLP on the test/holdout set. NPV refers to the negative predictive value. D) Performance metrics for the MLP model on the test/holdout set. E) Left, beeswarm plot illustrating how the top 20 most important features in the MLP impact the model’s output. Right, bar chart showing mean absolute SHAP values for each feature in the beeswarm plot. Each row of the bar chart is aligned with feature rows of the beeswarm plot.

