
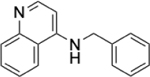
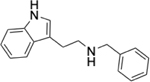
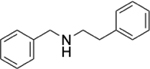
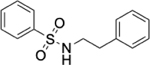
Table 2.
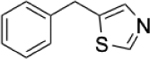
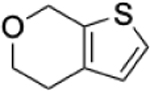
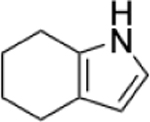
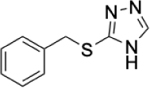
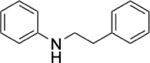
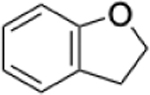
Substructures enriched in selective ROBIN RNA binders. Ten scaffolds and ring structures enriched in selective ROBIN RNA binders relative to SMM Non-RNA binders. Values indicate frequency of occurrence and fold change in binders relative to non-binders.
| Substructure | Selective ROBIN RNA Binders |
SMM NorvRNA Binders |
Fold Change |
|---|---|---|---|
|
| |||
|
0.31% | 0.01% | 31.0 |
|
0.31% | 0.05% | 6.20 |
|
0.62% | 0.15% | 4.13 |
|
0.31% | 0.08% | 3.88 |
|
0.31% | 0.08% | 3.88 |
|
0.47% | 0.14% | 3.36 |
|
1.09% | 0.36% | 3.03 |
|
0.39% | 0.14% | 2.79 |
|
0.31% | 0.12% | 2.58 |
|
0.39% | 0.16% | 2.44 |