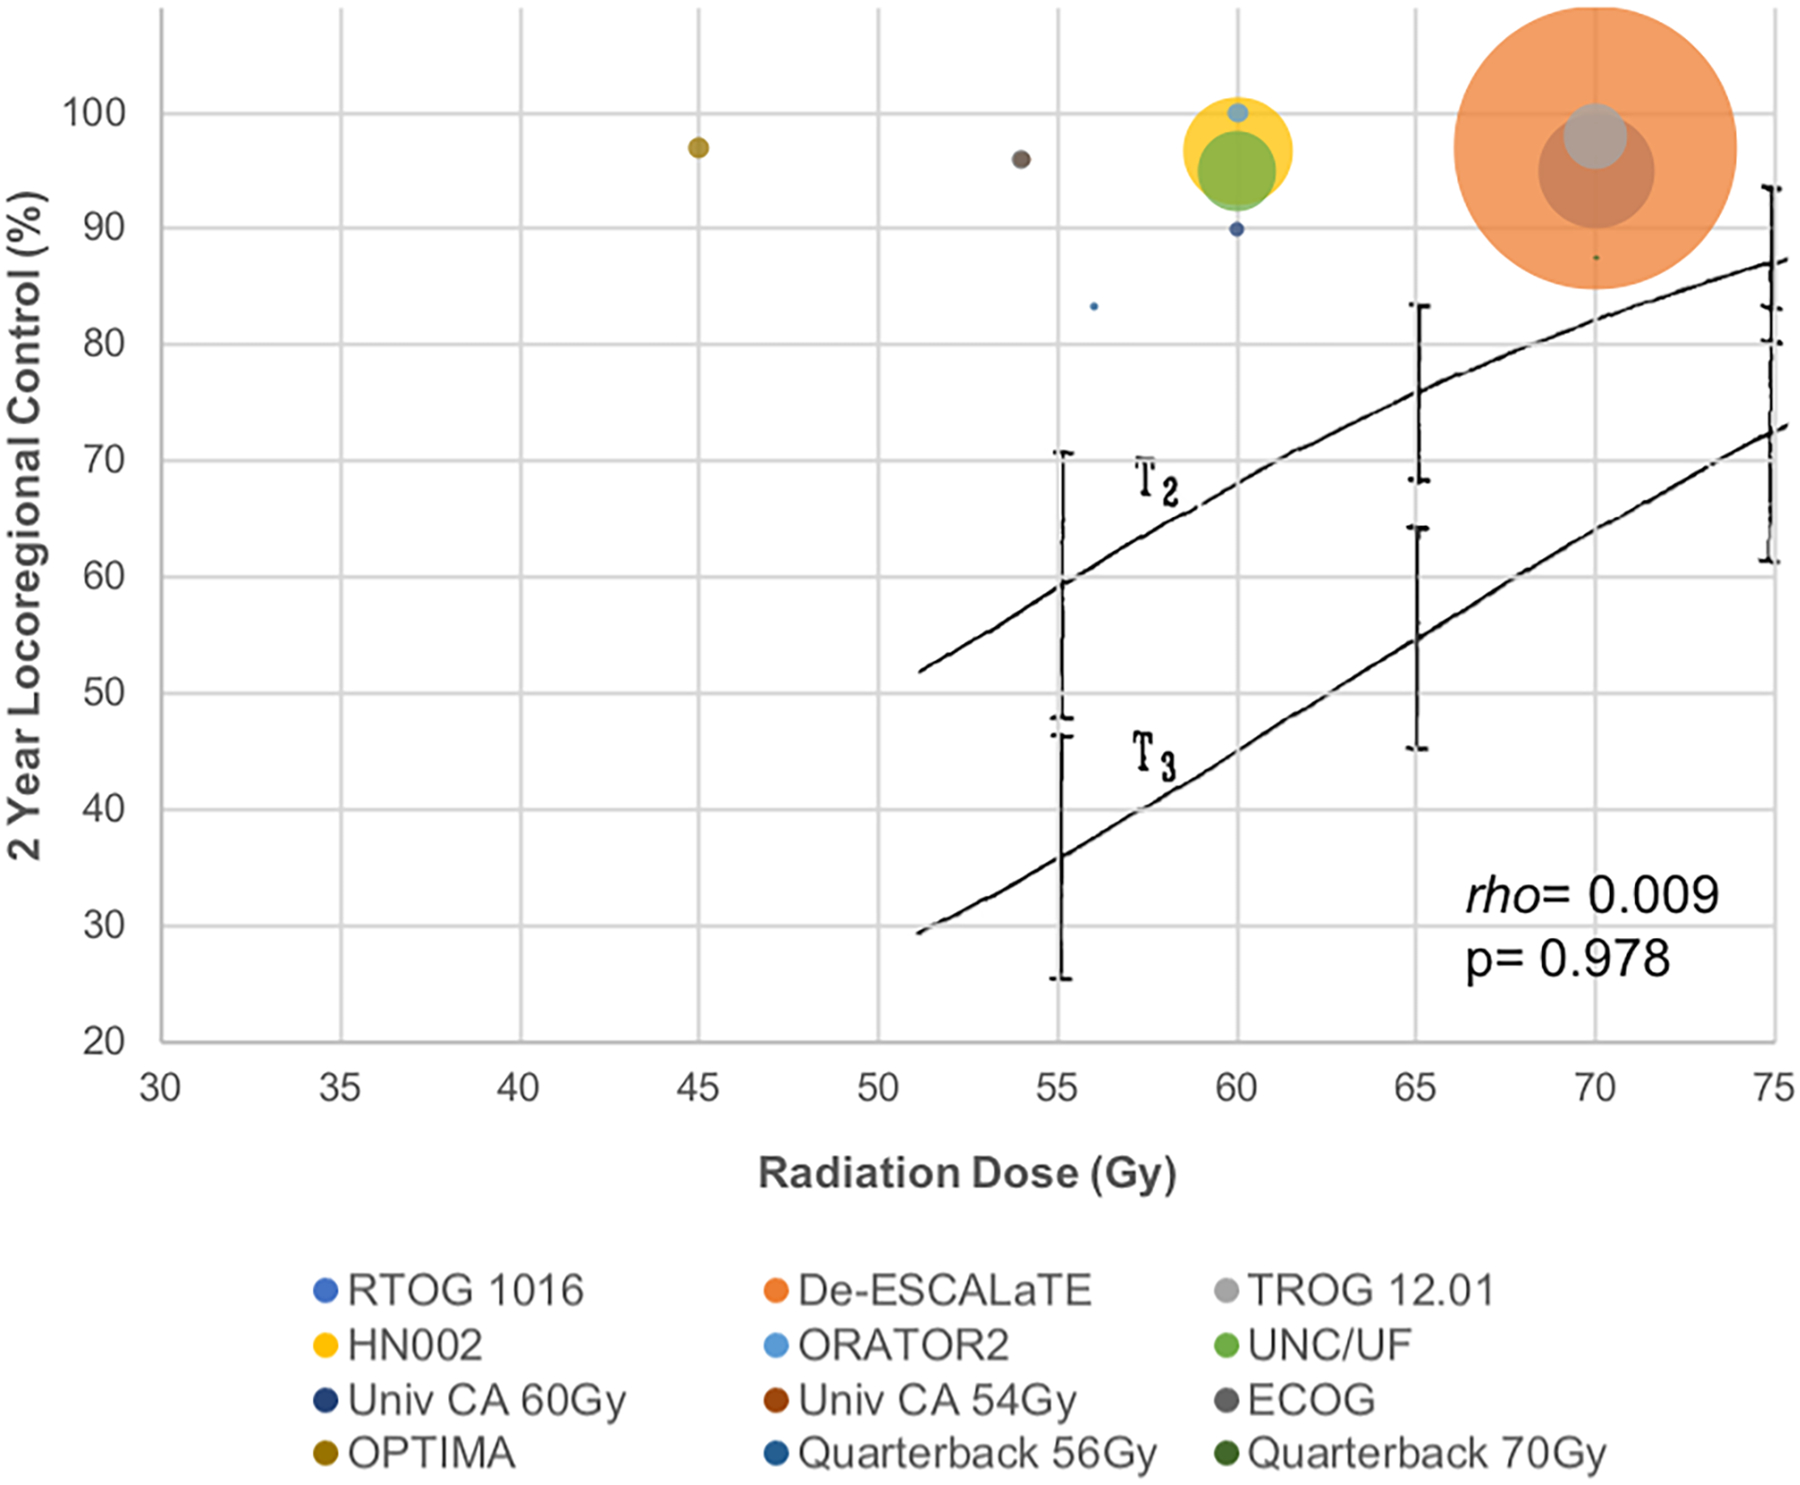
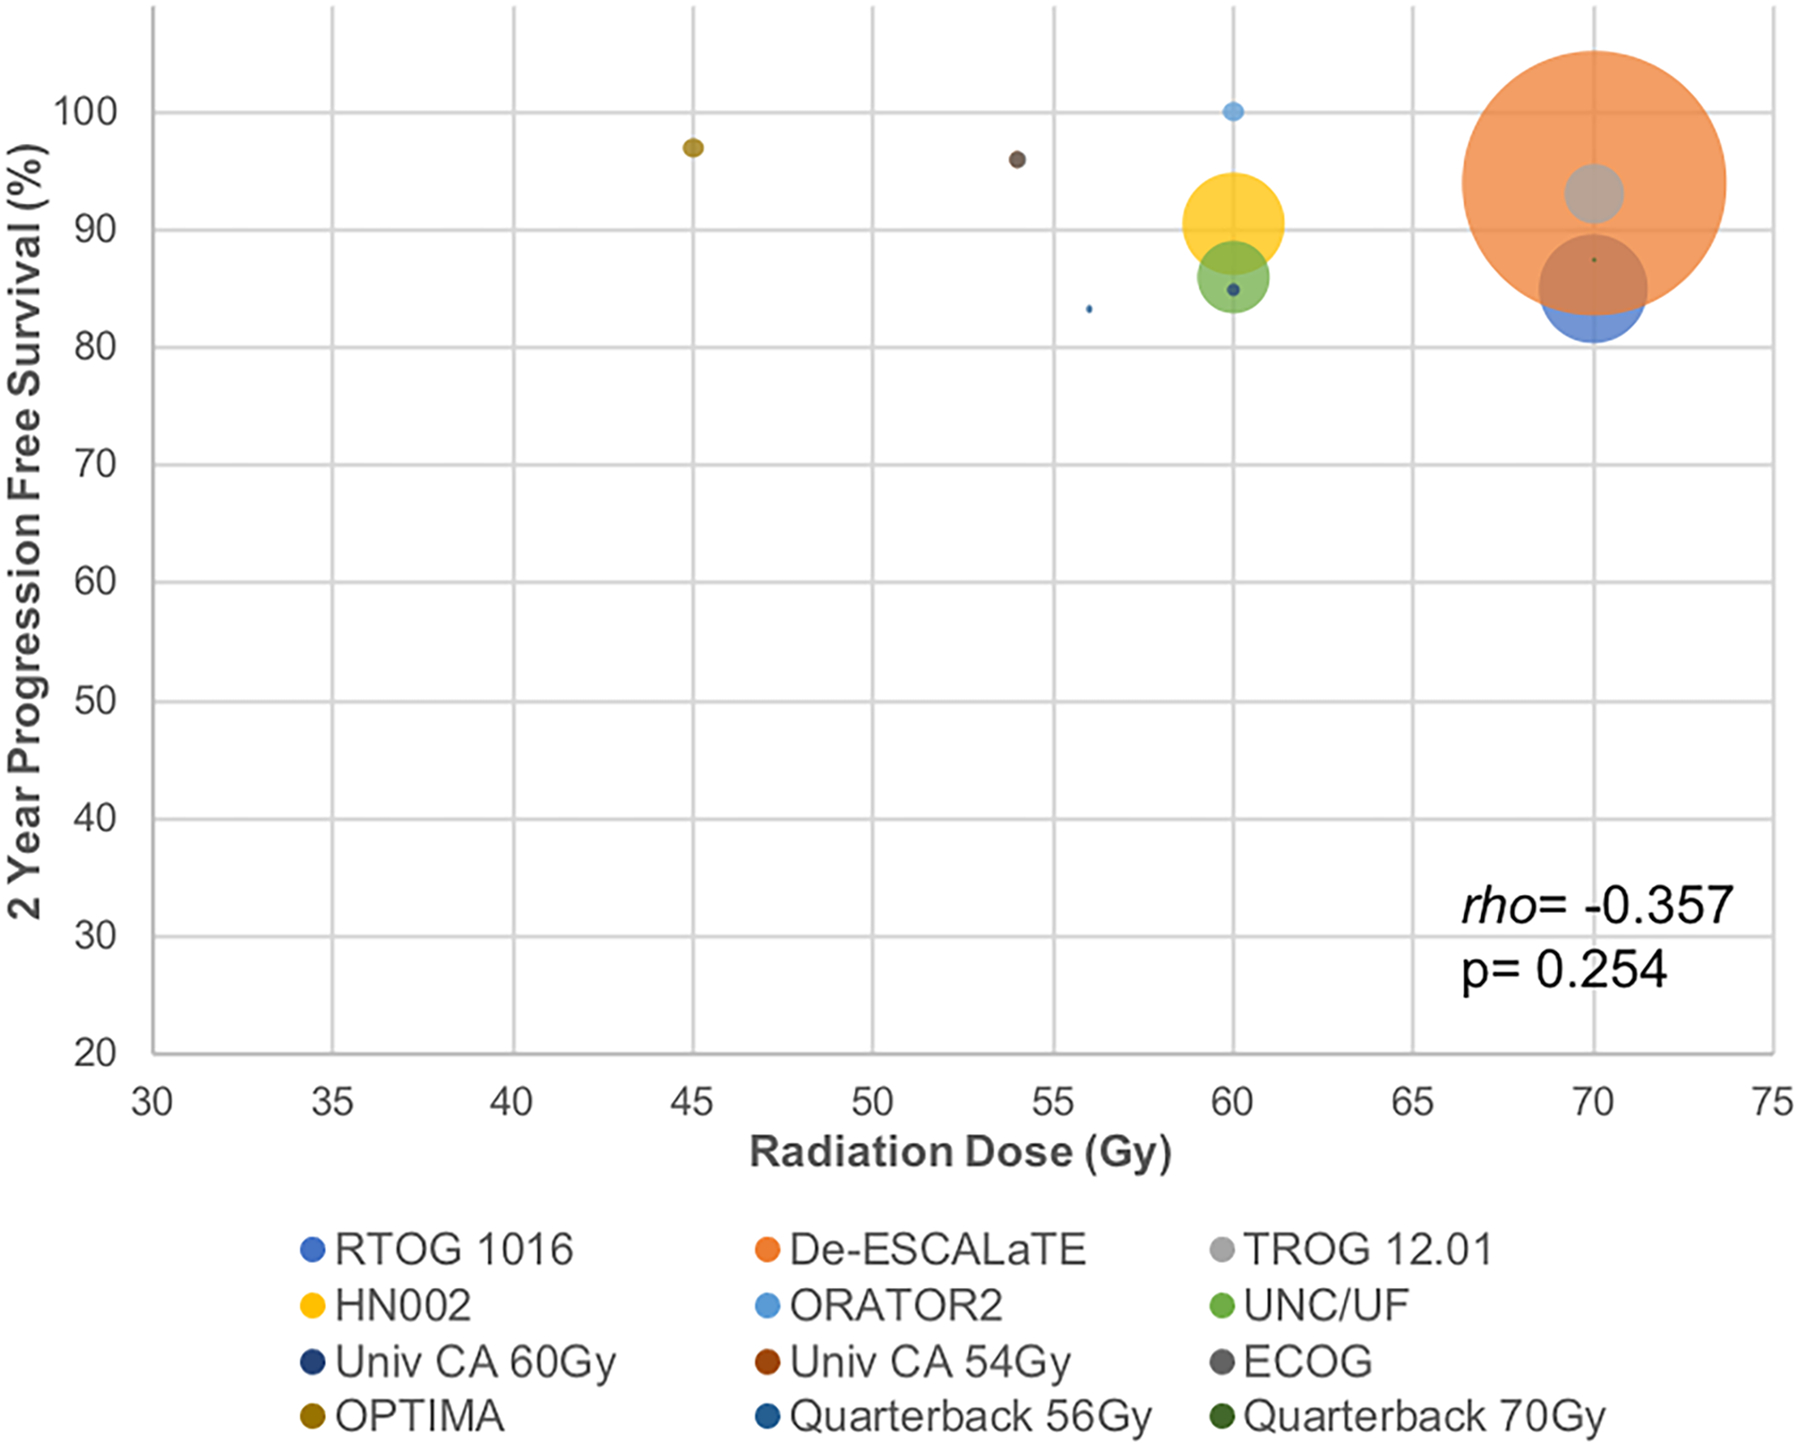
Figure 3.


Tumor control probability (TCP) dose-response curves with definitive chemoradiation in HPV+ OPC.
(A) Bubble plot of LRC rates from modern chemoradiation trials (colored circles) shows no relationship between radiation dose and LRC (rho= 0.009, p= 0.978). Superimposed seminal T2 and T3 tonsil cancer TCP curves with radiation (black lines) modeled at the turn of the century117 (predating concurrent chemotherapy use) show shallow LRC improvements when increasing radiation doses from 55–75Gy.
(B) Bubble plot of PFS rates from modern chemoradiation trials show no relationship between radiation dose and PFS (rho= −0.357, p= 0.254).
