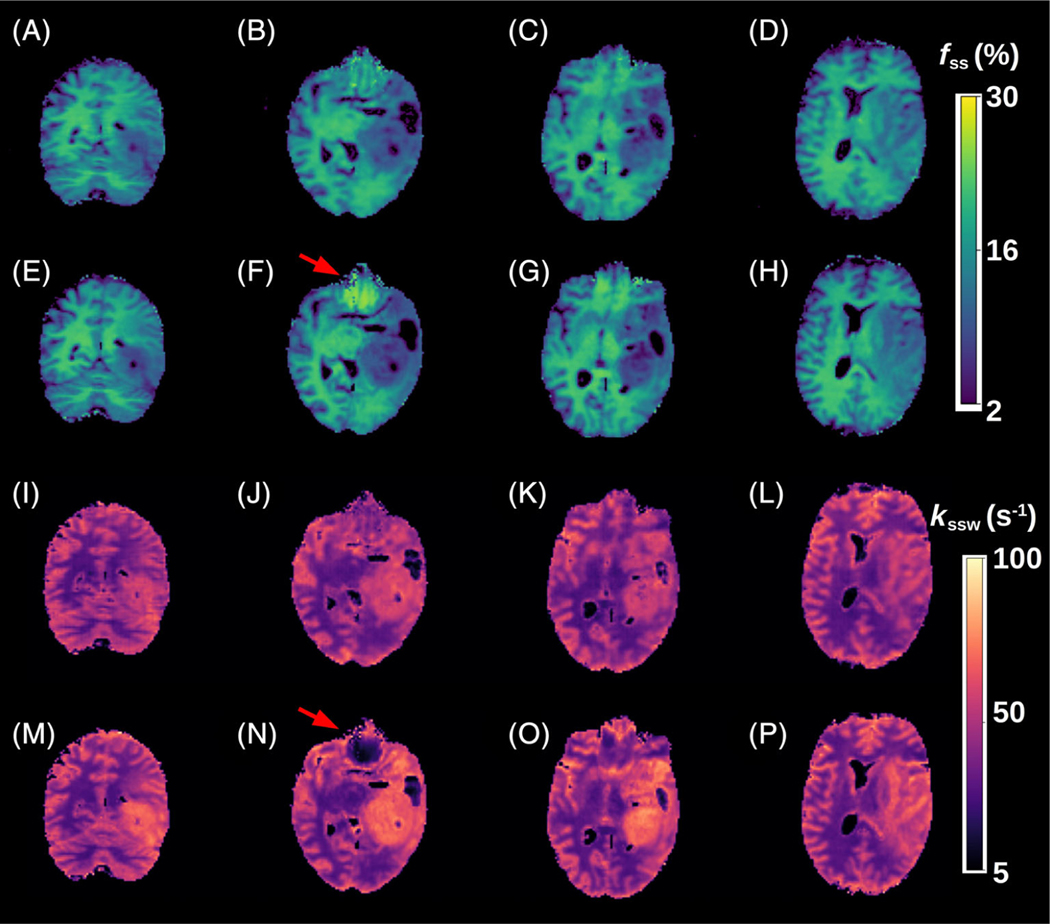
FIGURE 5.
Quantitative semisolid magnetization transfer (MT) parameter maps from a glioblastoma patient. (A–D) Generative adversarial network (GAN)-saturation transfer (ST)-based semi-solid MT proton volume fraction maps, obtained with N = 9. (E–H) chemical exchange saturation transfer (CEST)-magnetic resonance fingerprinting (MRF)-based semisolid MT proton volume fraction maps, obtained with M = 30. (I-L) GAN-ST-based semi-solid MT proton exchange rate maps, obtained with N = 9. (M-P) CEST-MRF-based semi-solid MT proton exchange rate maps, obtained with M = 30. The red arrows indicate regions with susceptibility artifacts.

