
Figure 1.
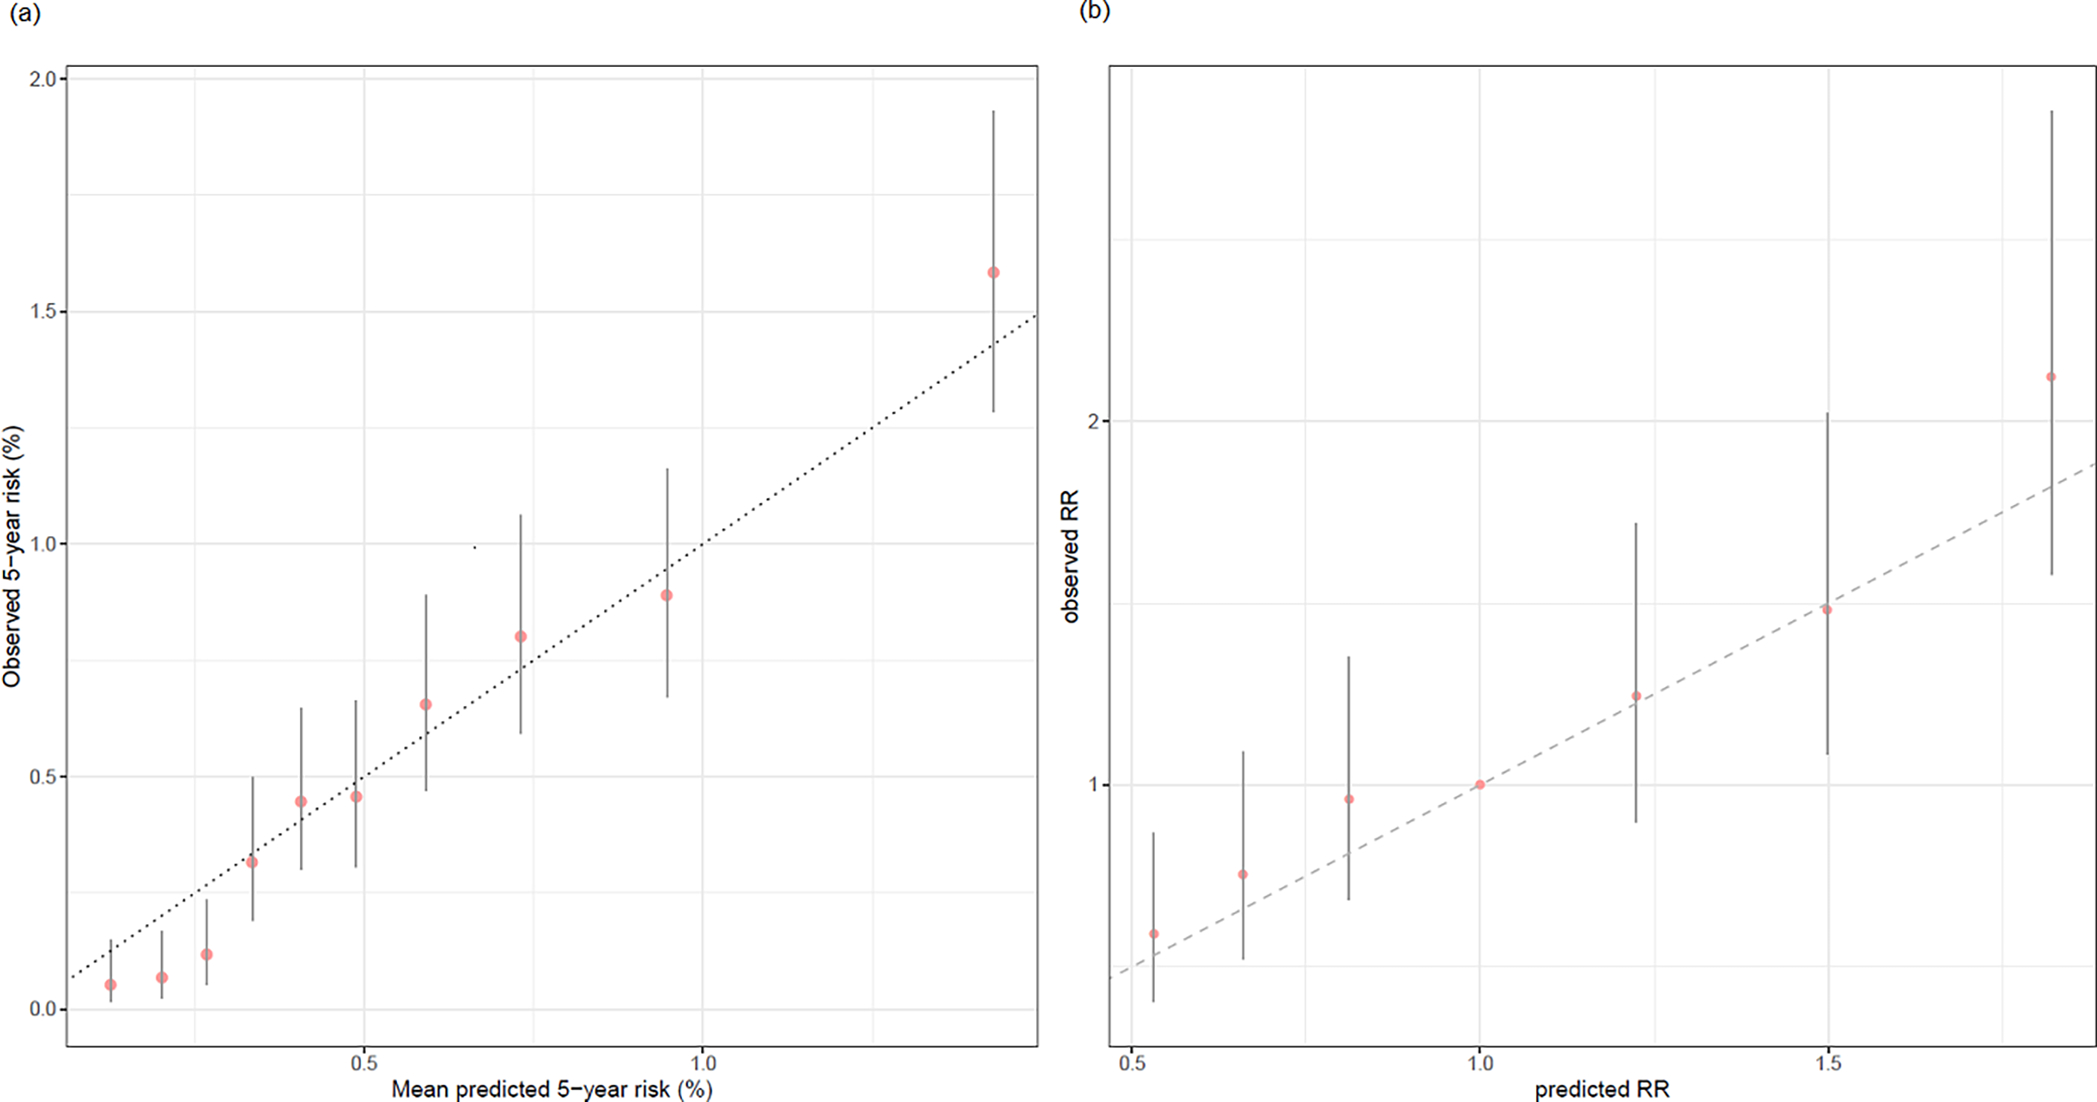
Calibration plots of 5-year absolute risk and relative risk of PRS with risk-based and PRS-based stratification. We demonstrated the calibration of 5-year absolute risk based on the PRS-enhanced model (1(a); left panel) and relative risk of PRS (1(b); right panel) stratified by deciles of predicted risk (left) and PRS (right) in GERA participants of European-ancestry. The x-axis is the average of predicted absolute (left) and relative (right) risk values by deciles. The y-axis is the average observed absolute (left) and relative (right) risks by deciles of predicted absolute risk (left) and PRS (right), along with their 95% CIs indicated by the vertical error bars.