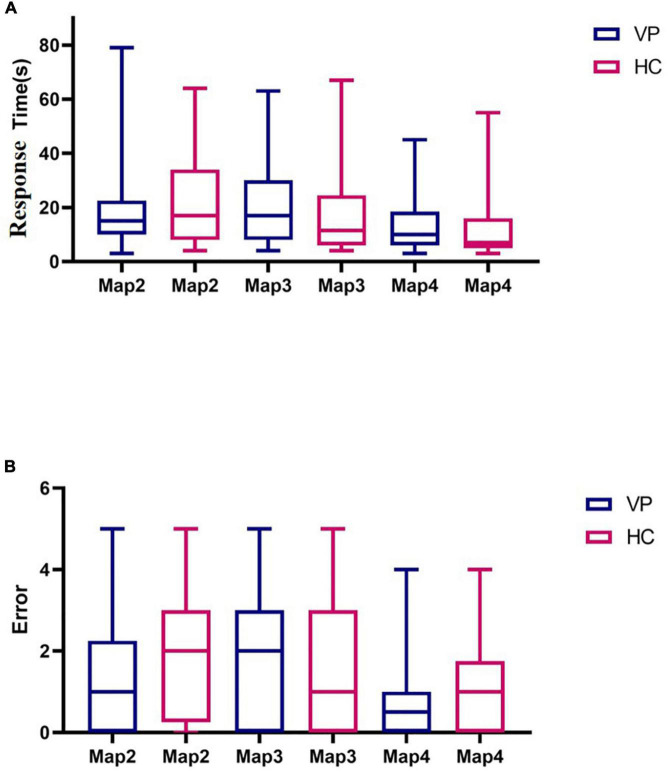
FIGURE 13.
Comparison of three dimensional (3D) driving test indexes between VP and HC. (A) Response time spent in Maps 2, 3, and 4 for VP and HC, respectively. (B) The number of errors in Maps 2, 3, and 4 of VP and HC, respectively. The upper and lower lines represent the 95th and 5th percentiles, respectively, and the horizontal line within the box is the median. VP, patients with vertigo; HC, healthy controls.

