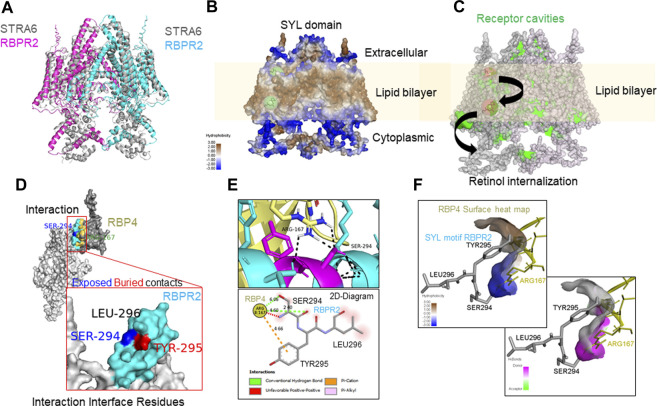
FIGURE 2.
Molecular docking analysis of RBPR2-RBP4 protein interaction. (A) RBPR2 structural alignment with STRA6 dimer (pdb 5SY1). (B) Heat map indicating varying degrees of hydrophobicity within RBPR2, showing the lipid bilayer embedded regions in a RBPR2 dimer complex. The retinol binding prediction on RBPR2 dimer was performed by PyRX showing the possible regions of binding and internalization of retinol from extracellular matrix to cytosol, by utilizing the receptor cavities indicated in green on the right diagram (ref BIOVIA® Discovery Studio Visualizer v21.1). (C) The docking of RBPR2 monomer (Light grey) and RBP4 (Dark grey) structure showing the interactions. The interaction interface residues are color-coded, Cyan for RBPR2 residues and Yellow for RBP4. To annotate the positional exposed and buried residues information the SER-294 blue and TYR-295 Red color coded. (D,E) The interaction of residues and 2D-Diagram showing the mode of interactions by Hydrogen bonds, Pi-Cation, Pi-Alkyl and solvent accessible surface in Red shade. (F) The surface heat map of hydrophobicity and hydrogen bond of RBP4 surface showing the SYL motif of RBPR2 interacting in the pocket, analyzed by BIOVIA® Discovery Studio Visualizer v21.1.

