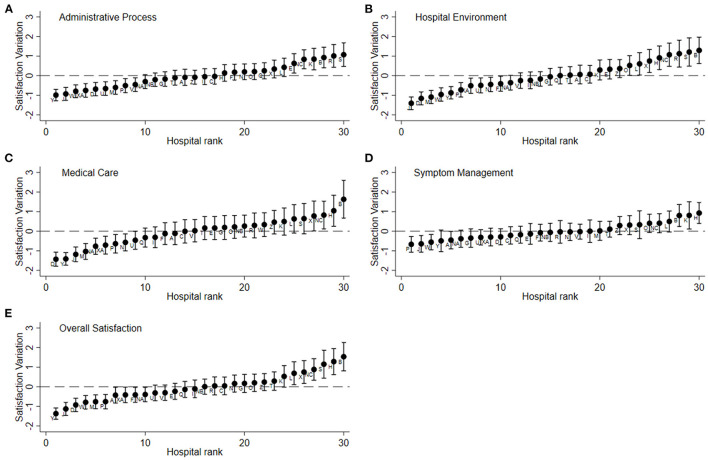
Figure 2.
Satisfaction variation among hospitals after case-mix adjustment. (A) Administrative process, (B) hospital environment, (C) medical care, (D) symptom management, (E) overall satisfaction. Y axis, satisfaction variation (random effect and standard error) by hospitals; X axis, hospital rank sorted by random effect. All models are adjusted with variables: sex, age, education, annual family income, cancer type, cancer stage, self-reported health status, length of stay and actual respondent.

