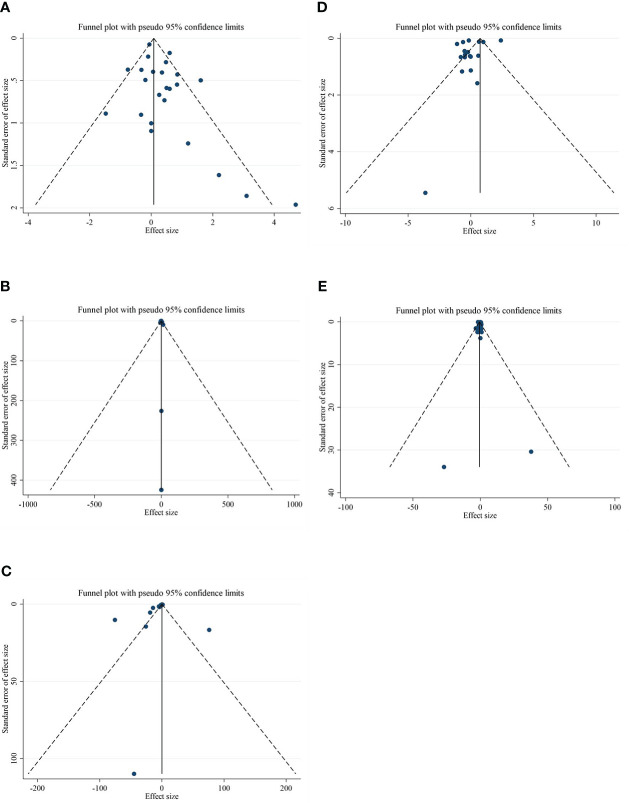
Figure 3.
Funnel plots for the effect of CLA consumption on (A) CRP (mg/L), (B) IL-6 (pg/ml), (C) TNF-α (ng/ml), (D) adiponectin (µg/ml), and (E) leptin (ng/ml). Horizontal lines represent 95% CIs. Diamonds represent pooled estimates from random-effects analysis. WMD, weighted mean difference; CI, confidence interval; CLA, conjugated linoleic acid; CRP, C-reactive protein; IL-6, interleukin 6; TNF-α, tumor necrosis factor-alpha.

