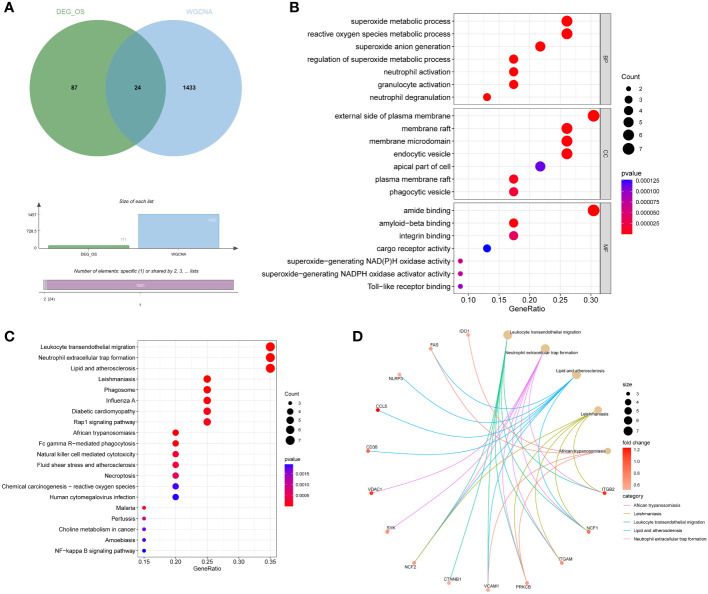
Figure 4.
Acquisition and functional enrichment analysis of DEIOSGs. (A) Venn diagrams of DEIOSGs. (B) The GO outcomes are displayed with a bubble plot. (C) A bubble plot was constructed to illustrate the KEGG outcomes. (D) Results of KEGG are depicted on circle charts. DEIOSGs, differentially expressed immune-related oxidative stress genes; GO, Gene Ontology; KEGG, Kyoto Encyclopedia of Genes and Genomes; BP, biological process; CC, cellular component; MF, molecular function.

