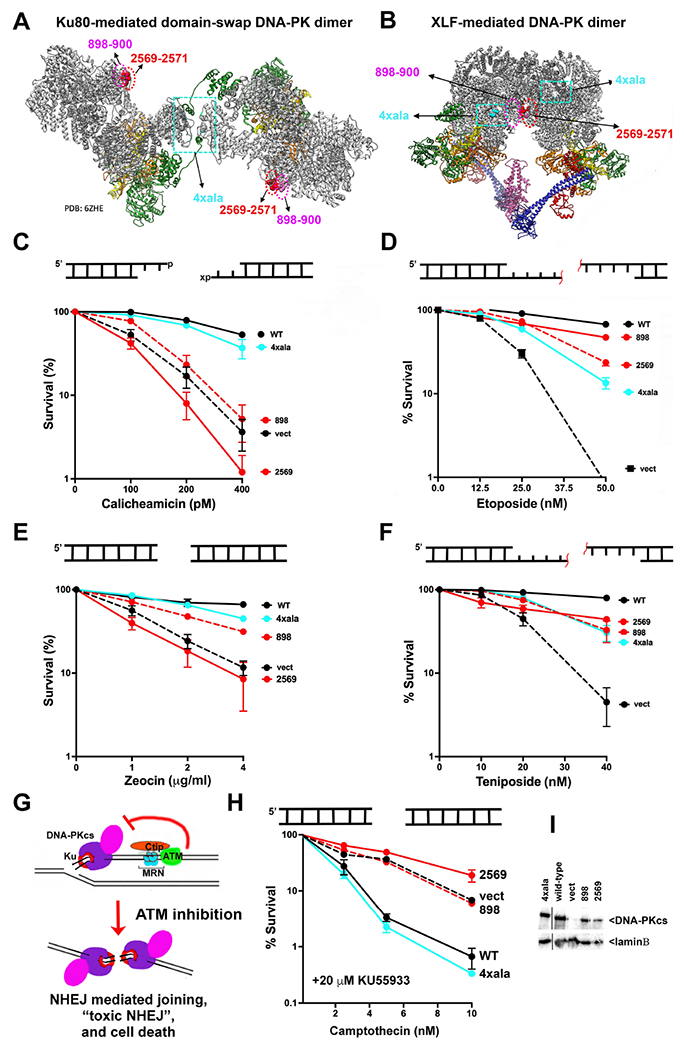
Figure 2. Ablation of the two DNA-PK mediated dimers has distinct impacts on sensitivity to different radio-mimetic drugs.

(A + B) Ribbon diagrams of the domain-swap (PDB: 6ZHE) and XLF-mediated (PDB:7NFC) long-range complexes. DNA-PKcs is shown in grey, Ku80 in green, Ku70 in orange and DNA in yellow (left). Insert shows interaction of 4 basic residues with the Ku80 C-terminal helix. (C-H) Cartoon depicting end structures generated by drugs utilized. “x” denotes 3’PG adduct. Red line denotes peptide adduct on 4bp 5’ overhang. V3 clonal transfectants expressing wild-type or mutant DNA-PKcs as indicated were plated at cloning densities into complete medium with increasing doses of zeocin, calicheamicin, teniposide, etoposide, or camptothecin (in the presence of 20 μM KU55933). Colonies were stained after eight days, and percent survival was calculated. Error bars represent the standard error of the mean for at least three independent experiments. (G) Cartoon depicting toxic NHEJ. (I) Immunoblot for DNA-PKcs expression in V3 transfectants.
