
Extended Data Fig. 4. Biomarker evaluation of HDAC6 score calculated by using the NetBID and VIPER algorithms in the phase Ib trial.
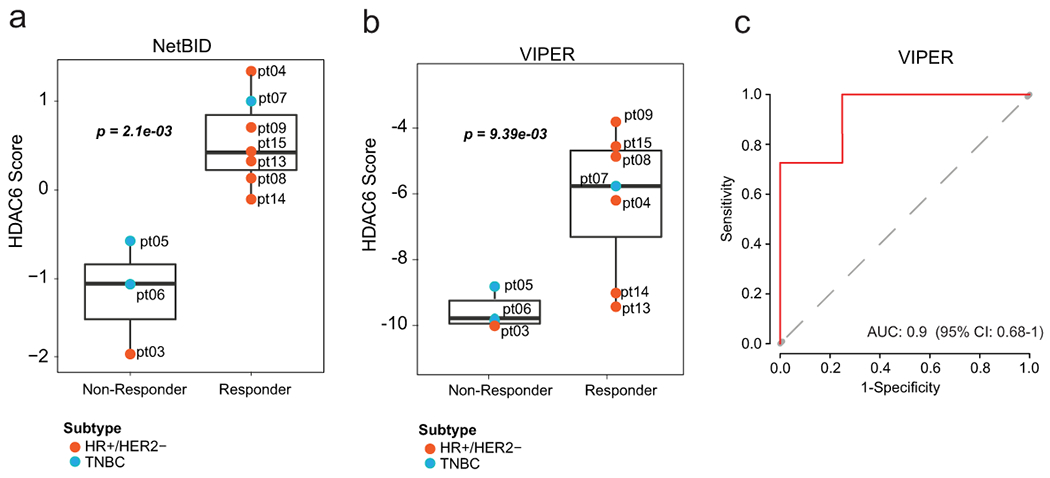
The Supplementary Extended Data Fig. shows the similarities between the HDAC6 scores inferred by NetBID (a) and VIPER (b) in responders and non-responders, and (c) ROC curve plot of HDAC6 score inferred by VIPER (similar plot for NetBID is in Fig. 3d). In a and b, one dot represents one patient sample and the center line indicates the median value. The lower and upper hinges represent the 25th and 75th percentiles, respectively, and whiskers denote 1.5x interquartile range. P value was estimated by two-tailed t test. For all panels n=3 non-responders and n=7 responders.