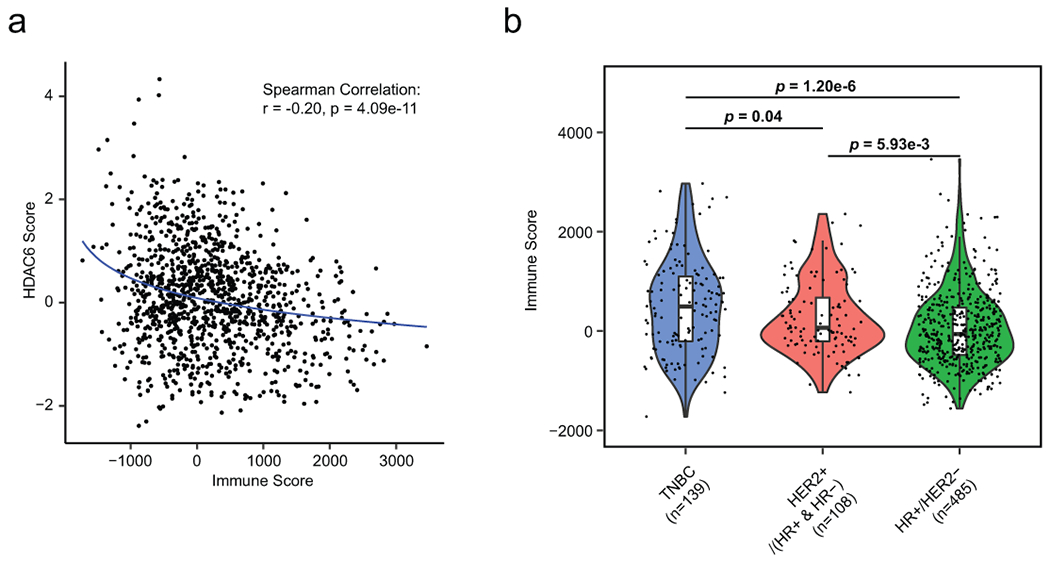
Extended Data Fig. 7. The correlation of HDAC6 score with immune infiltrates.

(a) Scatter plot showing the correlation between HDAC6 score and immune score by ESTIMATE in TCGA-BRCA primary patient samples (n=1109). The correlation coefficient (R) and P value were estimated using Spearman correlation test. (b), Violin plot showing the distribution of immune score across IHC-based breast cancer subtypes. Sample size of each group was indicated in the axis labels. P value was estimated using two-tailed t test. The center line indicates the median value. The lower and upper hinges represent the 25th and 75th percentiles, respectively, and whiskers denote 1.5x interquartile range.
