
Extended Data Fig. 8. Ricolinostat treatment reduces the expression of c-MYC in sensitive cell lines.
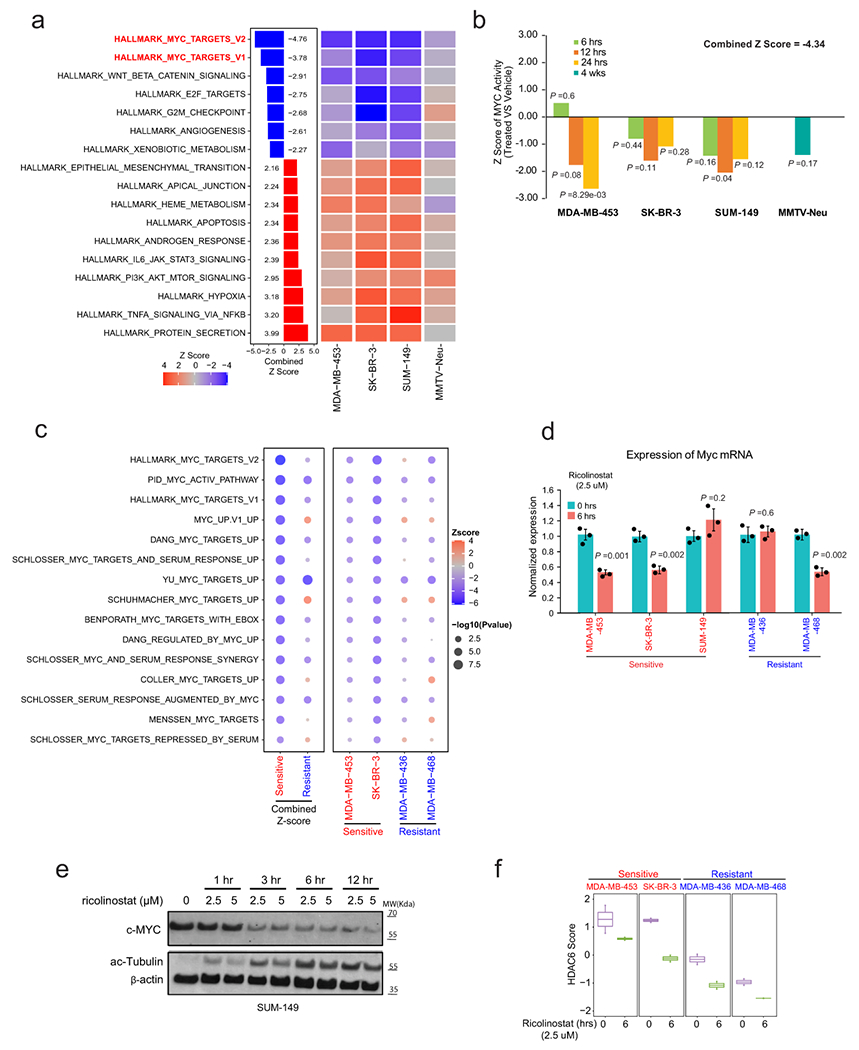
(a) Heatmap representing GSEA analysis of hallmark signatures during ricolinostat exposure in sensitive breast cancer cell lines and TgMMTV-Neu model. P value was estimated by two-tailed t test. The Z-scores were transformed from these P values and further combined using Stouffer’s method. Only significant (combined Z > 1.96 or < −1.96) sets are shown. (b) The graphic shows summarized z-scores in cell lines and TgMMTV-Neu sensitive to ricolinostat during a time curse treatment (6, 12, 24 hours and 4 weeks). For a and b N = 2 individual independent experiments for cell lines and N=3 individual tumors for TgMMTV-Neu. P value was estimated using two-tailed t test. (c) Bubble plot representing GSEA analysis of multiple MYC-associated signatures after ricolinostat in sensitive and resistant cells. N = 3 independent experiments per cell line. P value was estimated by two-tailed t test. The Z-score was transformed from the P values and further combined by Stouffer’s method. (d) QRT-PCR of c-Myc mRNA expression after 6 hours of exposure to ricolinostat. N = 3 independent experiments for each time point All effort bars represent Mean±SD. P value was estimated by two-tailed t test. (e) The WT-blot shows the changes in the protein expression of c-Myc and ac-Tubulin in SUM-149 cells after ricolinostat is added to the culture media. WT-blot results were reproduced n=3 times from independent experiments. (f) Graphic showing an efficient reduction in the HDAC6 score after treatment with ricolinostat in multiple cell lines, n≥2 independent experiments per time point. The center line indicates the median value. The lower and upper hinges represent the 25th and 75th percentiles, respectively, and whiskers denote 1.5x interquartile range.