
Extended Data Fig. 9. Acetylation of c-Myc in Lys148 after inhibition of HDAC6.
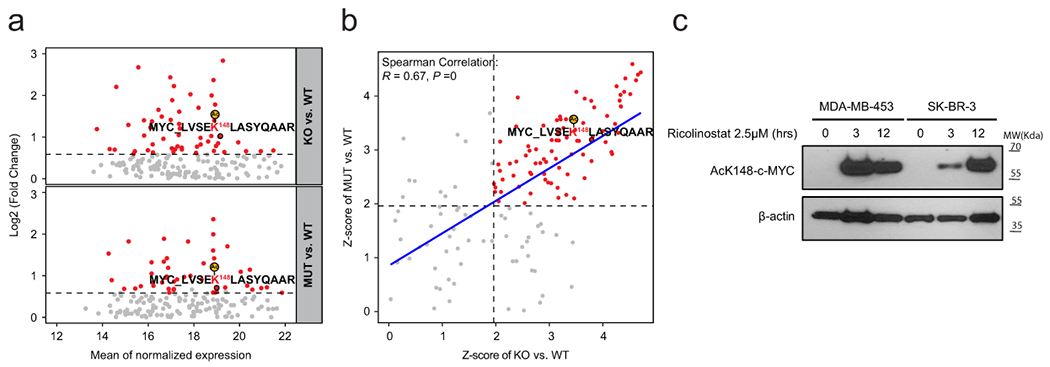
a) MA plots showing the peptides upregulated upon HDAC6 knockout (above) and HDAC6 catalytic domain 2 mutants (below). In the MA-plots, each dot represents a peptide. The significantly upregulated peptides were identified by fold change > 1.5 and p-value < 0.05 and highlighted in red. P value was estimated by two-tailed t test. (b) Scatter plot showing the correlation of the Z-score of the comparison between HDAC6 KO and wild type with that of the comparison between HDAC6 mutant and wild type. The curve was fitted by stat_smooth algorithm using lm smoothing method and y~x formula. The correlation coefficient (R) and P value were estimated using two-tailed Spearman correlation test. Each dot represents a peptide. For a and b the N = 2 independent proteomic replica studies per cell line. c) The western blot shows the accumulation of ac-K148-c-Myc after HDAC6 is inhibited by ricolinostat in MDA-MB-453 and SK-BR-3 BC lines. WT-blot results were reproduced n=3 times from independent experiments.