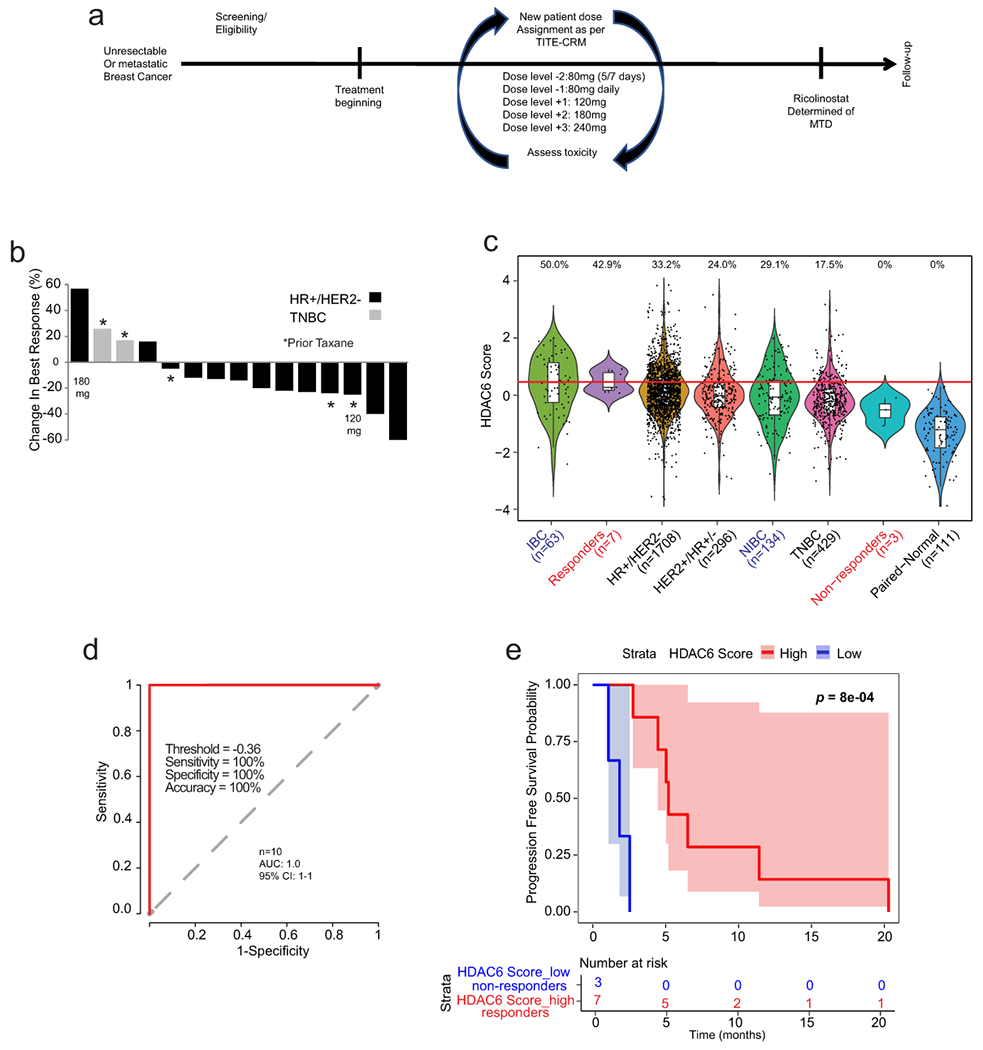
Fig. 3. Phase 1b trial of ricolinostat combined with nab-paclitaxel in metastatic breast cancer.

(a) Graphical description of the clinical study. (b) Waterfall plot showing the tumor best response for patients with measurable disease. Of the 16 patients, 3 were TNBCs (1 showed stable disease (SD) and 2 showed progressive disease (PD). The rest 13 patients were of the HR+/HER2− subtype (2 showed a partial response (PR), 9 showed SD and 2 showed PD. Note that one evaluable patient with stable disease did not have measurable disease and is not included in the waterfall plot (n=15). (c) The bar graph shows the HDAC6 scores in the patients in the trial (labeled in red) together with all the BC samples evaluated and separated by subtype. Labeled in blue are the IBC and the matched non-IBC series. The center line indicates the median value. The lower and upper hinges represent the 25th and 75th percentiles, respectively, and whiskers denote 1.5x interquartile range. The red line represents the median of the HDAC6 scores in IBC samples and the numbers above each whisker plot indicate the percentage of samples over this value in each clinical subtype. Sample size of each group was indicated in the axis labels. The full list of p values can be found summarized in the Source Data and was estimated using two-tailed t test. (d) Receiver operating characteristic (ROC) curve plot for evaluation of HDAC6 score to predict the response of patients with breast cancer to ricilinostat from the clinical trial. The recommended cutoff of the HDAC6 score and corresponding sensitivity, specificity, and accuracy were inside the box (n=2 independent HDAC6 score replicates per patient) (e) Kaplan – Meier graphic showing the survival of the patients in the study separated by HDAC6 score (high/low= higher and lower than −0.36, the cutoff ofHDAC6 score based on the ROC analysis in the study. In this study 10 out of 16 evaluable patients had tissue available for translational analyses. P value was estimated using two-tailed Log-Rank test.
