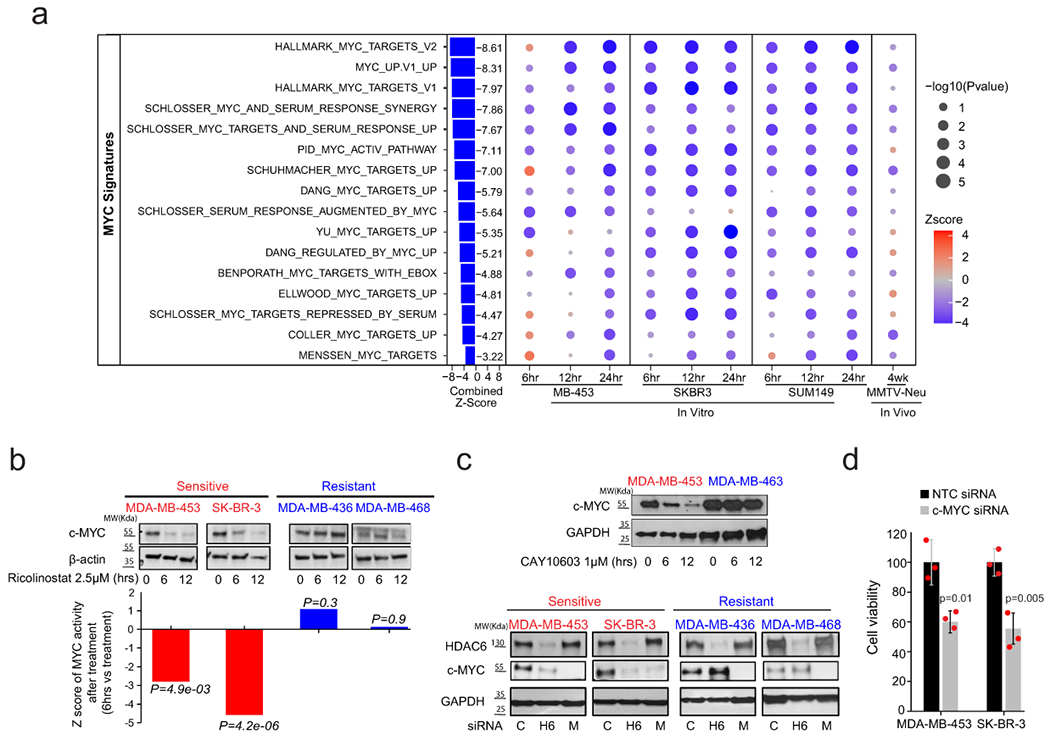
Fig. 5. Treatment with ricolinostat induces a robust reduction of MYC expression and activity.

(a) Bubble plot representing GSEA analysis of MYC signatures during ricolinostat exposure in sensitive breast cancer cells. The size and intensity of the bubble indicate the statistical significance. N = 2 independent experiments for each time point of each BC cell line or mouse model. P value was estimated by two-tailed t test. The Z-scores were transformed from these P values and further combined using Stouffer’s method. (b) The upper panel (WT-blots) shows the reduction of MYC protein expression after ricolinostat treatment (2.5 μM) in sensitive but not resistant cancer cells. WT-blot results were reproduced n=3 times from independent experiments. The lower panel shows the summarized z-scores, comparing Ricolinostat-treated (6hrs) vs. untreated in the same cell lines shown in the upper panel. The Z-score was transformed from the P value estimated by two-tailed t test. (c) WT-blots showing the reduction of MYC in sensitive cell lines when HDAC6 was inhibited by the small molecule inhibitor CAY10603 (1μM, upper panel) or by RNAi (100nM, lower panel) (c=non-targeting siRNA control, H6=siRNA targeting HDAC6, M= siRNA targeting MYC). WT-blot results were reproduced n=3 times from independent experiments. (d) Cell viability (cell number) after MYC is silenced by siRNA in ricolinostat sensitive cell lines (notice that the western blot showing efficient silencing of MYC is shown in Fig. 5c). N=3 independent experiments per siRNA and cell line. Data are presented as mean values +/−SD. P values was estimated by two-tailed t test.
