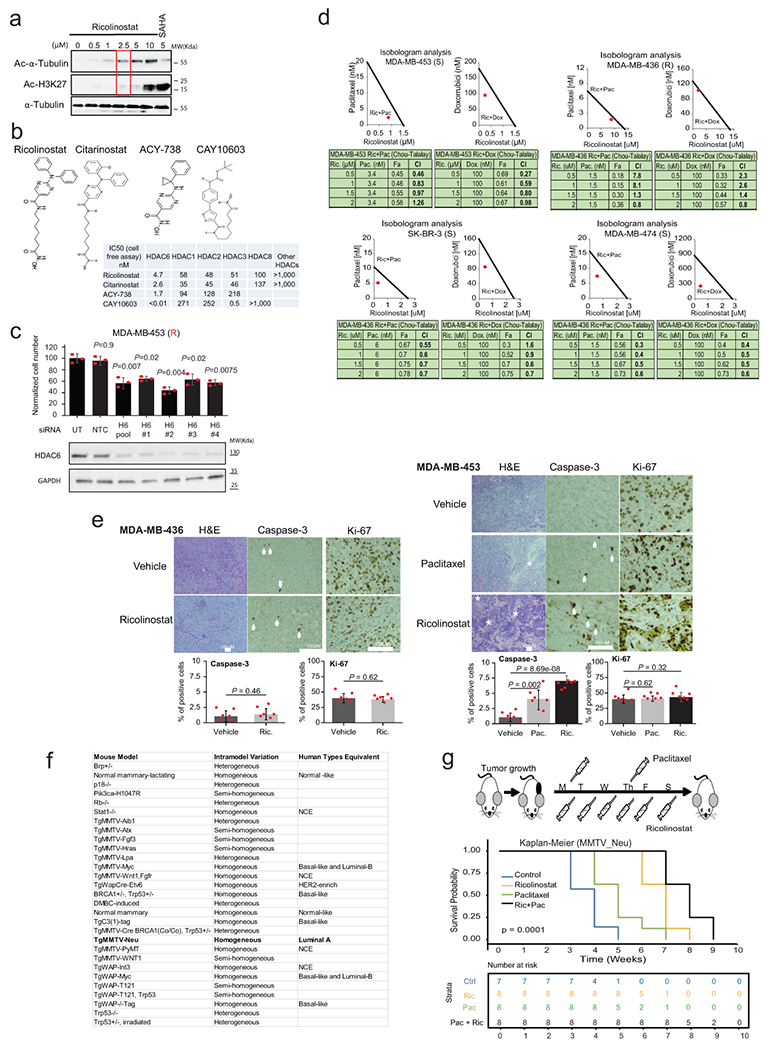
Extended Data Fig. 2. Anticancer activity of HDAC6 inhibitors.

(a) The western blot shows the titration of ricolinostat to identify an effective dose (accumulation of Ac-α-Tubulin) without off-target effects in class-I HDACs (accumulation of Ac-H3K27). SAHA is used as a control Pan-HDAC inhibitor. WT-blot results were reproduced n=3 times from independent experiments. (b) Chemical structure of the different HDAC6 inhibitors used in Fig. 1E. (c) Normalized cell number 6 days after transfection with individualized siRNAs targeting HDAC6 or non-targeting control (NTC) (n=3 independent independent experiments per siRNA). The WT-blots show the silencing efficiency. WT-blot results were reproduced n=3 times from independent experiments. All error bars represent Mean±SD. P value was estimated by two-tailed t test. (d) The graphic shows the lack of synergistic activity between ricolinostat and commonly used chemotherapy (paclitaxel and doxorubicin) in MDA-MB-436 cells. In contrast, cells sensitive to ricolinostat MDA-MB-453, SK-BR-3 and MDA-MB-474 show synergistic activity between ricolinostat and chemotherapy. R and S indicate ricolinostat resistance and sensitivity respectively. N=3 independent replicate experiments per drug combination and concentration. (e) Histological intratumoral evaluation of H&E, Caspase-3, and Ki-67 in tumor samples from Fig. 1B. Quantification is also shown in bar graphs. Notice that the combo treatment (Pac+Ric) is not shown because all tumors regressed with this treatment. The white asterisks indicate necrotic areas and the white arrows indicate Caspase-3 positive stained cells. All error bars represent Mean±SD. P value was estimated by two-tailed t test. N= 6 samples from individual tumors. (f) The list shows all the transgenic mouse models evaluated by the HDAC6 score in Fig. 2c and d and indicates their correlation with human BCs. (g) Kaplan – Meier graphic showing the survival of the MMTV tumors in Fig. 2e. Control n=7; ricolinostat (Ric) n=8; paclitaxel (Pac) n=8; Ric+Pac n=8. P value was estimated using two tailed Log-Rank test.
