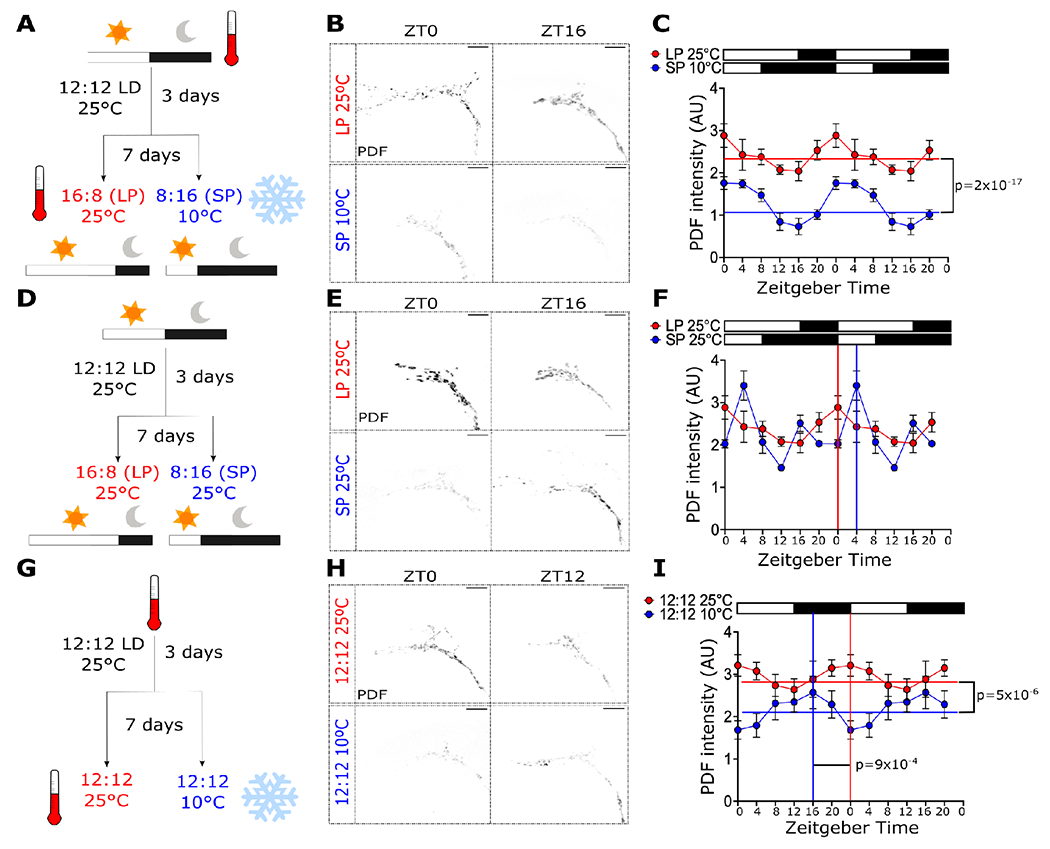
Figure 1. PDF levels are regulated by photoperiod and temperature.

PDF levels in the s-LNv dorsal terminals were analyzed in flies entrained to (A) long-photoperiod (LP, 16:8 LD) at 25°C or short-photoperiod (SP, 8:16 LD) at 10°C, (D) LP or SP at 25°C, and (G) 12:12 LD cycles at 25°C or 10°C. Representative images for these conditions at ZT0 and ZT16 or ZT12 are shown in B, E and H, respectively. Double-plotted graphs of PDF signal for each condition are shown in C, F and I, respectively. White boxes represent lights-on, and black boxes represent lights-off. CircaCompare and RAIN was used to determine rhythmicity and phase for all datasets. MESOR (horizontal lines) and phase (vertical lines) are displayed in the graphs if statistically significant (p < 0.05), except for (F), where the phases detected between CircaCompare and RAIN were different. The phases shown in (F) were calculated using RAIN. Scale bars are 10 μm. Number of brains imaged were LP25: ZT0 n = 18, ZT4 n = 11, ZT8 n = 13, ZT12 n = 18, ZT16 = 9, ZT20 n = 14; SP10: ZT0 n = 9, ZT4 n = 8, ZT8 n = 14, ZT12 n = 14, ZT16 = 18, ZT20 n = 20; SP25 ZT0 n = 6, ZT4 n = 8, ZT8 n = 9, ZT12 n = 6, ZT16 =10, ZT20 n = 3; 12:12 25°C: ZT0 n = 14, ZT4 n = 14, ZT8 n = 15, ZT12 n = 19, ZT16 =10, ZT20 n = 15; 12:12 10°C: ZT0 n = 13, ZT4 n = 14, ZT8 n = 15, ZT12 n = 15, ZT16 =16, ZT20 n = 10.
