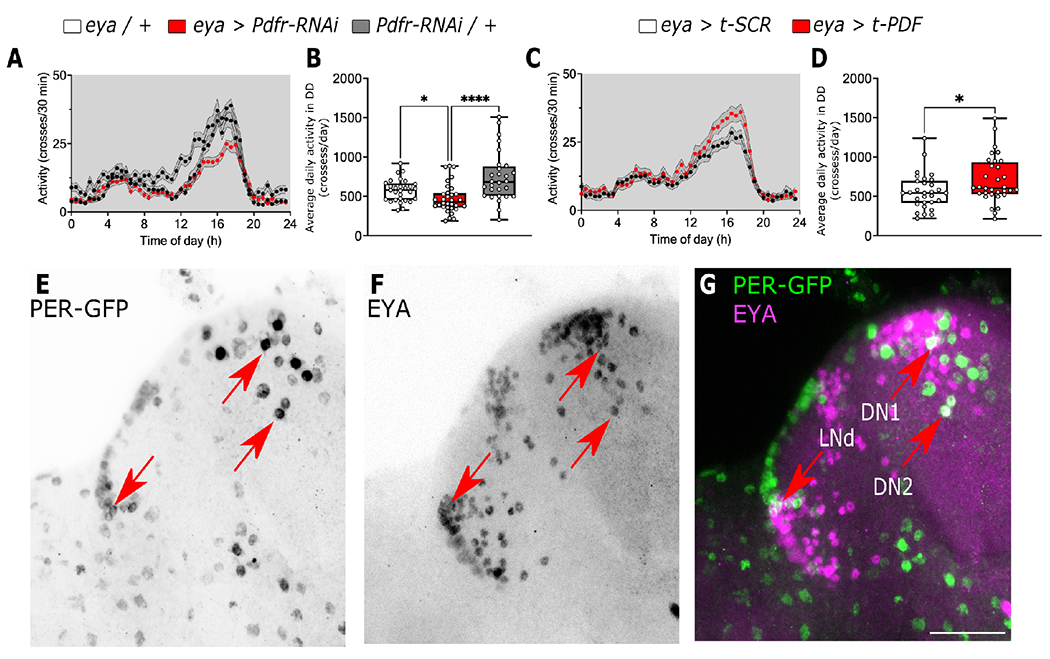
Figure 4. PDF modulates overall locomotion through eya+ cells.

(A-B) Average locomotor activity of flies in constant darkness at 25°C where the PDF receptor was knocked down in eya+ cells (eya > Pdfr-RNAi red line and box) compared to controls (eya / + and Pdfr-RNAi / +, black and gray lines, respectively). (C-D) Average locomotor activity of flies where a membrane tethered version of PDF was expressed in eya+ cells (eya > t-PDF red line and box) compared to the expression of a scrambled version of the peptide (eya > t-SCR black line and box). (E-G) Confocal images of fly brain expressing endogenous GFP tagged PER (green) and stained against EYA (magenta). Red arrows points DN1, DN2 and LNd clock populations. Scale bar is 25 μm. Data in B were analyzed with Kruskal-Wallis test followed by Dunnett’s multiple comparison test, Mann-Whitney in D. Number of flies used were eya / + n = 29, eya > Pdfr-RNAi n = 32, Pdfr-RNAi / + n = 28, eya > t-SCR n = 31, eya > t-PDF n = 31, eya / + n = 30. See also Figures S2 and S3.
