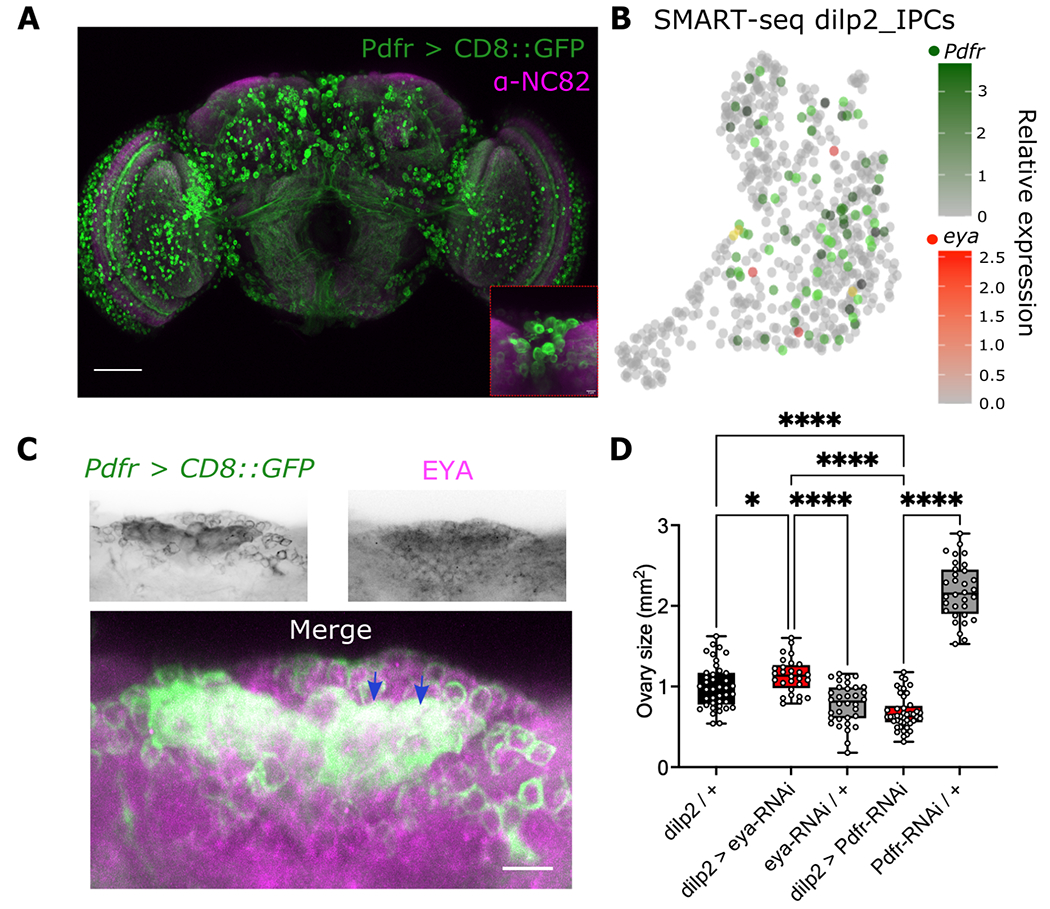
Figure 5. PDF and EYA have opposite effects in the IPCs to modulate ovary size under summer-like conditions (16:8 LD at 25°C).

(A) Expression of CD8::GFP was driven in the Pdfr+ cells using a Pdfr-gal4 driver. Nc82 antibody was used as counterstaining. Expression of CD8::GFP is observed in several segments of the brain, including the pars intercerebralis, containing the IPCs (inset). Scale bar is 50μm. (B) SMART-seq dataset from dilp2+ isolated IPCs from Fly Cell Atlas53 as UMPA, colored by Pdfr (green) and eya (red) expression. Coexpression is shown as yellow. Color bar denotes the relationship between color intensity and relative expression levels. (C) EYA staining (upper right panel) in brains of flies expressing CD8::GFP in the Pdfr+ cells (Pdfr > CD8::GFP, upper left panel). Merged image is observed in the bottom panel. Scale is 5 μm. (D) Comparison of ovary size in mm2 while knocking down eya (dilp2 > eya-RNAi) or knocking down Pdfr (eya > Pdfr-RNAi) compared to genetic controls (black and grey boxes). Data was analyzed using a one-way ANOVA followed by Holm-šidák’s multiple comparison test. Number of flies used were dilp2 / + n = 40, dilp2 > eya-RNAi n = 28, eya-RNAi / + n = 34, dilp2 > Pdfr-RNAi n = 45, UAS-Pdfr-RNAi / + n = 32.
