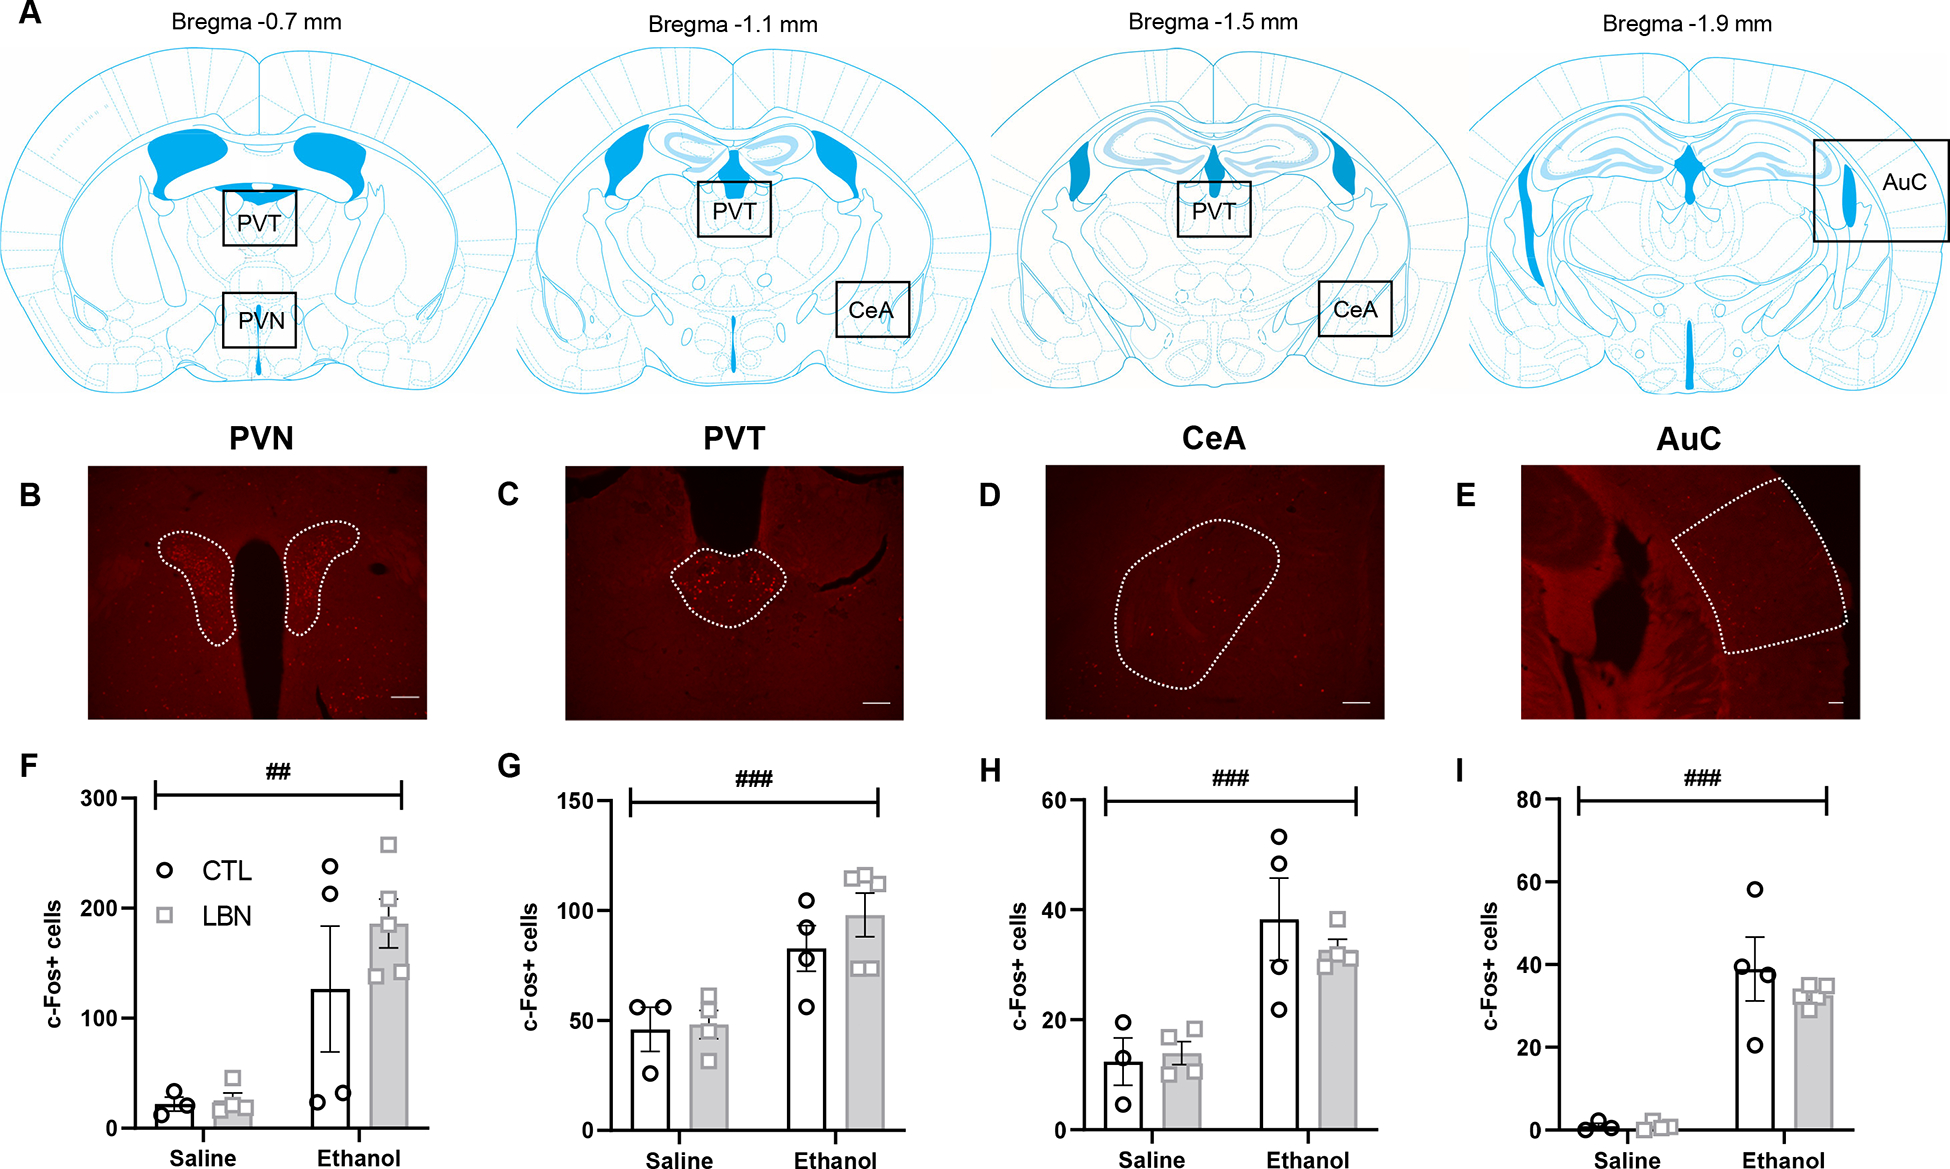
Figure 3. Acute cellular responses to alcohol in C57BL/6J females raised under CTL or LBN conditions (Experiment 2).

c-Fos-positive nuclei were quantified in the paraventricular nucleus of the hypothalamus (PVN, B and F), paraventricular nucleus of the thalamus (PVT, C and G), central nucleus of the amygdala (CeA, D and H), and auditory cortex (AuC, D and I) following administration of 2 g/kg ethanol. A. Brain section diagrams showing the location of images used for quantification (from Franklin & Paxinos, 2007). B-E. Representative images used for quantification (scale bar, 100 μm). F-I. Number of c-Fos-positive nuclei. ## or ###, main effect of ethanol, p<0.01 or p<0.001.
