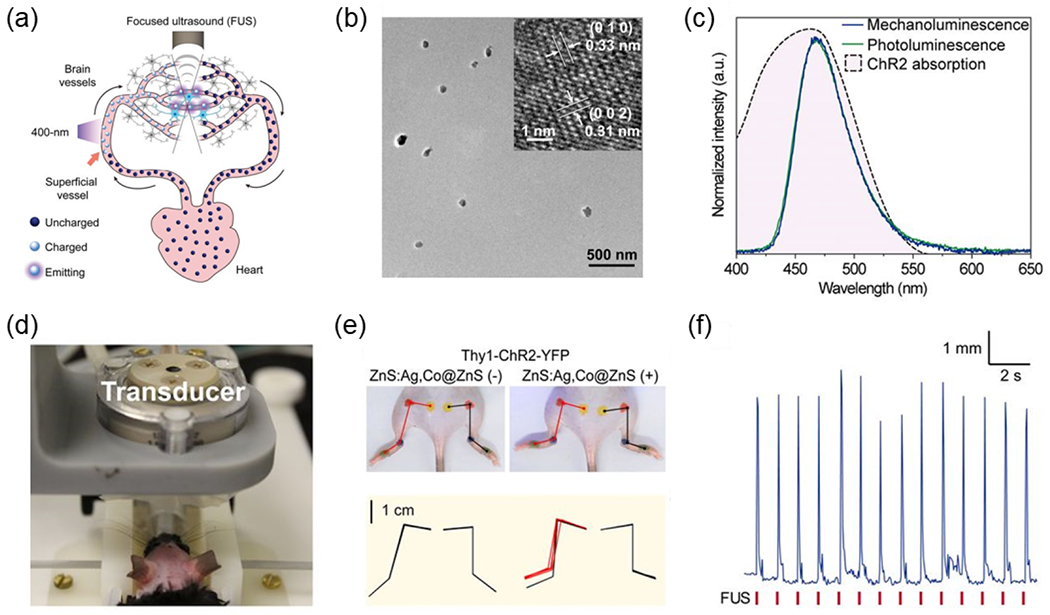
Fig. 7. Sono-optogenetic neuromodulation via FUS-triggered ML emission from MLNTs circulating in the blood.

(a) Schematic showing circulation of ZnS:Ag,Co@ZnS MLNTs in blood vessels, which transports 400-nm photoexcited MLNTs at superficial vessels into deep-brain regions to produce 470 nm emission under FUS for optogenetic stimulation. (b) TEM image of ZnS:Ag,Co@ZnS MLNTs and the inset is the high-resolution TEM image. (c) Normalized fluorescence (green) and mechanoluminescence (blue) emission spectra of ZnS:Ag,Co@ZnS MLNTs, largely overlapping with the absorption band of ChR2 (the pink shade under black dashed curve ). (d) Photograph of sono-optogenetic neuromodulation setup for mouse, highlighting the intact scalp of the shaved mouse. (e) Photographs and hindlimb kinematics of a Thy1-ChR2-YFP mouse during sono-optogenetic neuromodulation through intact scalp, before (Left) and after (Right) injection of ZnS:Ag,Co@ZnS MLNTs. In top images, the kinematics of left and right hindlimbs are shown in red and black lines, respectively. In bottom kinematic diagrams, contralateral limb activation via sono-optogenetic neuromodulation is highlighted in red. (f) Representative hindlimb movement of a Thy1-ChR2-YFP mouse injected with ZnS:Ag,Co@ZnS MLNTs under repetitive FUS stimulation. Reproduced from [23] with permission from National Academy of Sciences, Copyright 2019.
