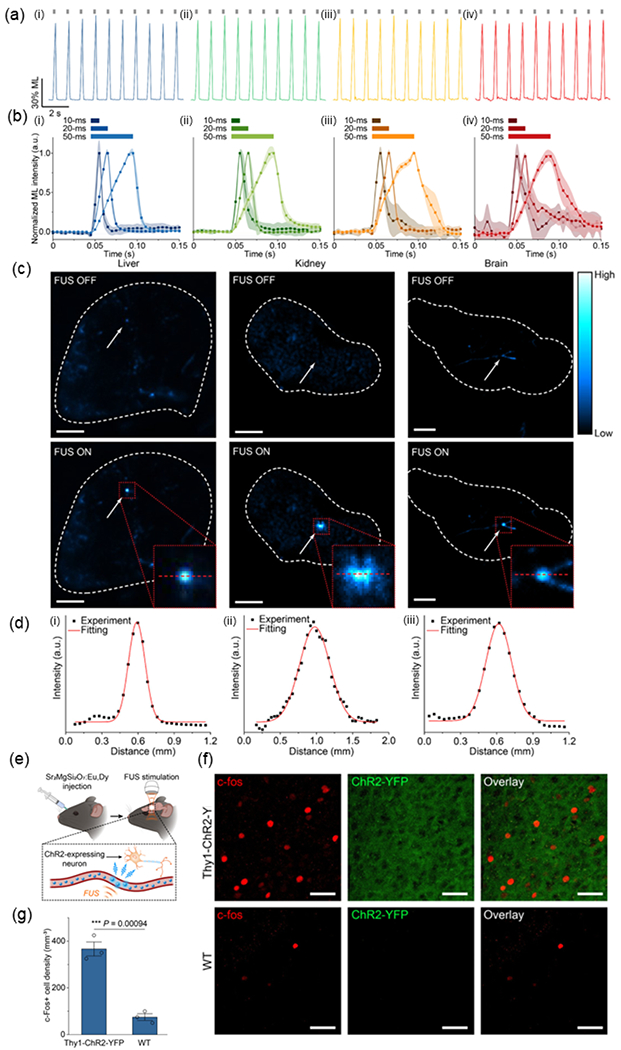
Fig. 9. A biomineralization approach to prepare ML colloidal NPs for sono-optogenetic neural modulation.

(a) Rechargeability demonstrated by multicolor ML colloids including: i) Sr2MgSi2O7:Eu,Dy , ii) ZnS:Cu,Al, iii) ZnS:Mn , and iv) CaTiO3:Pr in an artificial circulation tubing . The FUS pulses were shown as gray ticks above the emission curve. (b) ML temporal kinetics of ML colloids including: i) Sr2MgSi2O7:Eu,Dy, ii) ZnS:Cu,Al, iii) ZnS:Mn, and iv) CaTiO3:Pr upon FUS pulses with different duty cycles in the artificial circulation tubing . (c) Fluorescent images of the mouse organs including: i) liver, ii) kidney, and iii) brain with their blood vessels filled with Sr2MgSi2O7:Eu, Dy ML colloids with FUS off (top) and on (bottom), (d) ML intensity profiles of the emission spots from the mouse organs including: i) liver, ii) kidney, and iii) brain shown as red dashed lines in the inserted figures of (c), respectively. (e) Schematic of in vivo FUS-mediated optogenetic neuromodulation with Sr2MgSi2O7:Eu,Dy colloidal nanocrystals circulation in the motor cortex region of mouse brain. (f) Representative confocal fluorescence images of c-fos staining (left), ChR2-YFP (middle), and the overlay (right) of the same region of the motor cortex in Thy1-ChR2-YFP transgenic (top) and wild-type (bottom) mice after Sr2MgSi2O7:Eu,Dy colloidal nanocrystals were administered, recharged by UV light during blood circulation, and discharged under FUS to produce light emission. All scale bars are 40 μm. (g) Statistical analysis of c-fos+ cells’ density for the Thy1-ChR2-YFP and wild-type mice in (f). All data are presented as mean ± SD. n = 3 mice per group. One-way analysis of variance (ANOVA), *** P < 0.001. Reproduced from [68] with permission from American Chemical Society, Copyright 2022.
