
Figure 2 – DDK and Cdc5 phosphorylate the Mif2 PEST region in vitro.
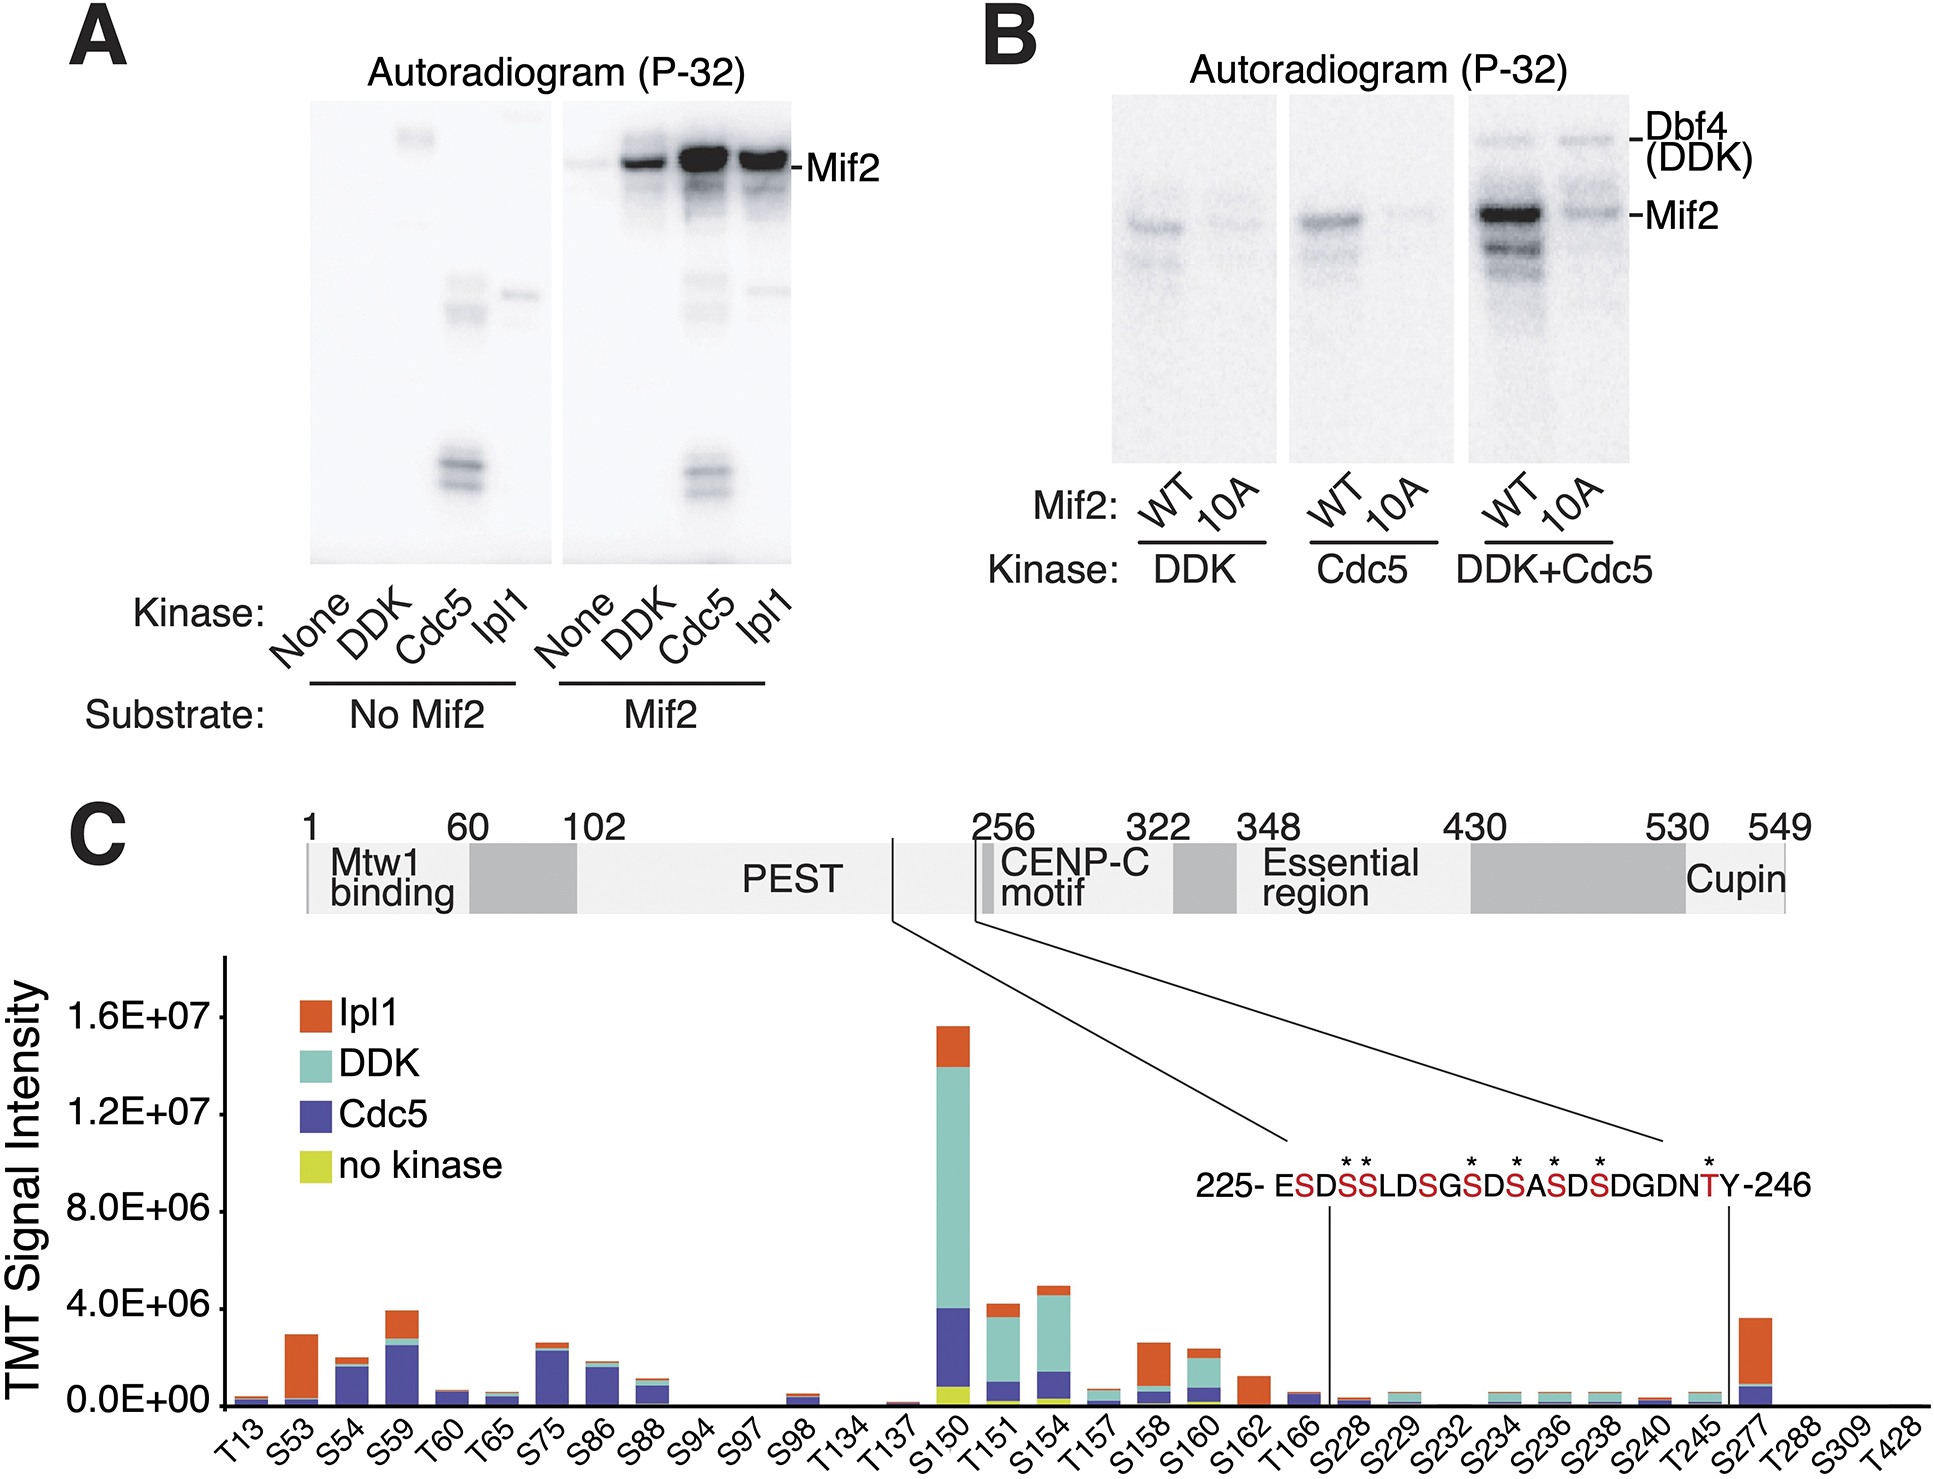
(A) DDK, Cdc5, and Ipl1 phosphorylate Mif2 in vitro. Purified full length Mif2 was incubated with the indicated kinases, and phosphate transfer from [γ-32P]ATP was detected by autoradiography. See also figure S3. (B) Kinase assays were performed as in panel A with the indicated substrates and enzymes (all panels from a single exposure). (C) Phosphorylation reactions with Mif2 and Cdc5, DDK, or Ipl1 were subjected to TMT-MS analysis (see Methods). Relative intensities of the same peptide treated with different kinases and unique TMT labels provide an accurate assessment of the relative contribution of each kinase to the abundance of a given phosphopeptide. Total signal intensities for different peptides primarily reflect unequal ionization efficiencies. The sequence of Mif2 residues 225–246 is shown, and residues that could be conclusively identified as phosphorylated are marked by stars. See also Data S1 and Table S1.