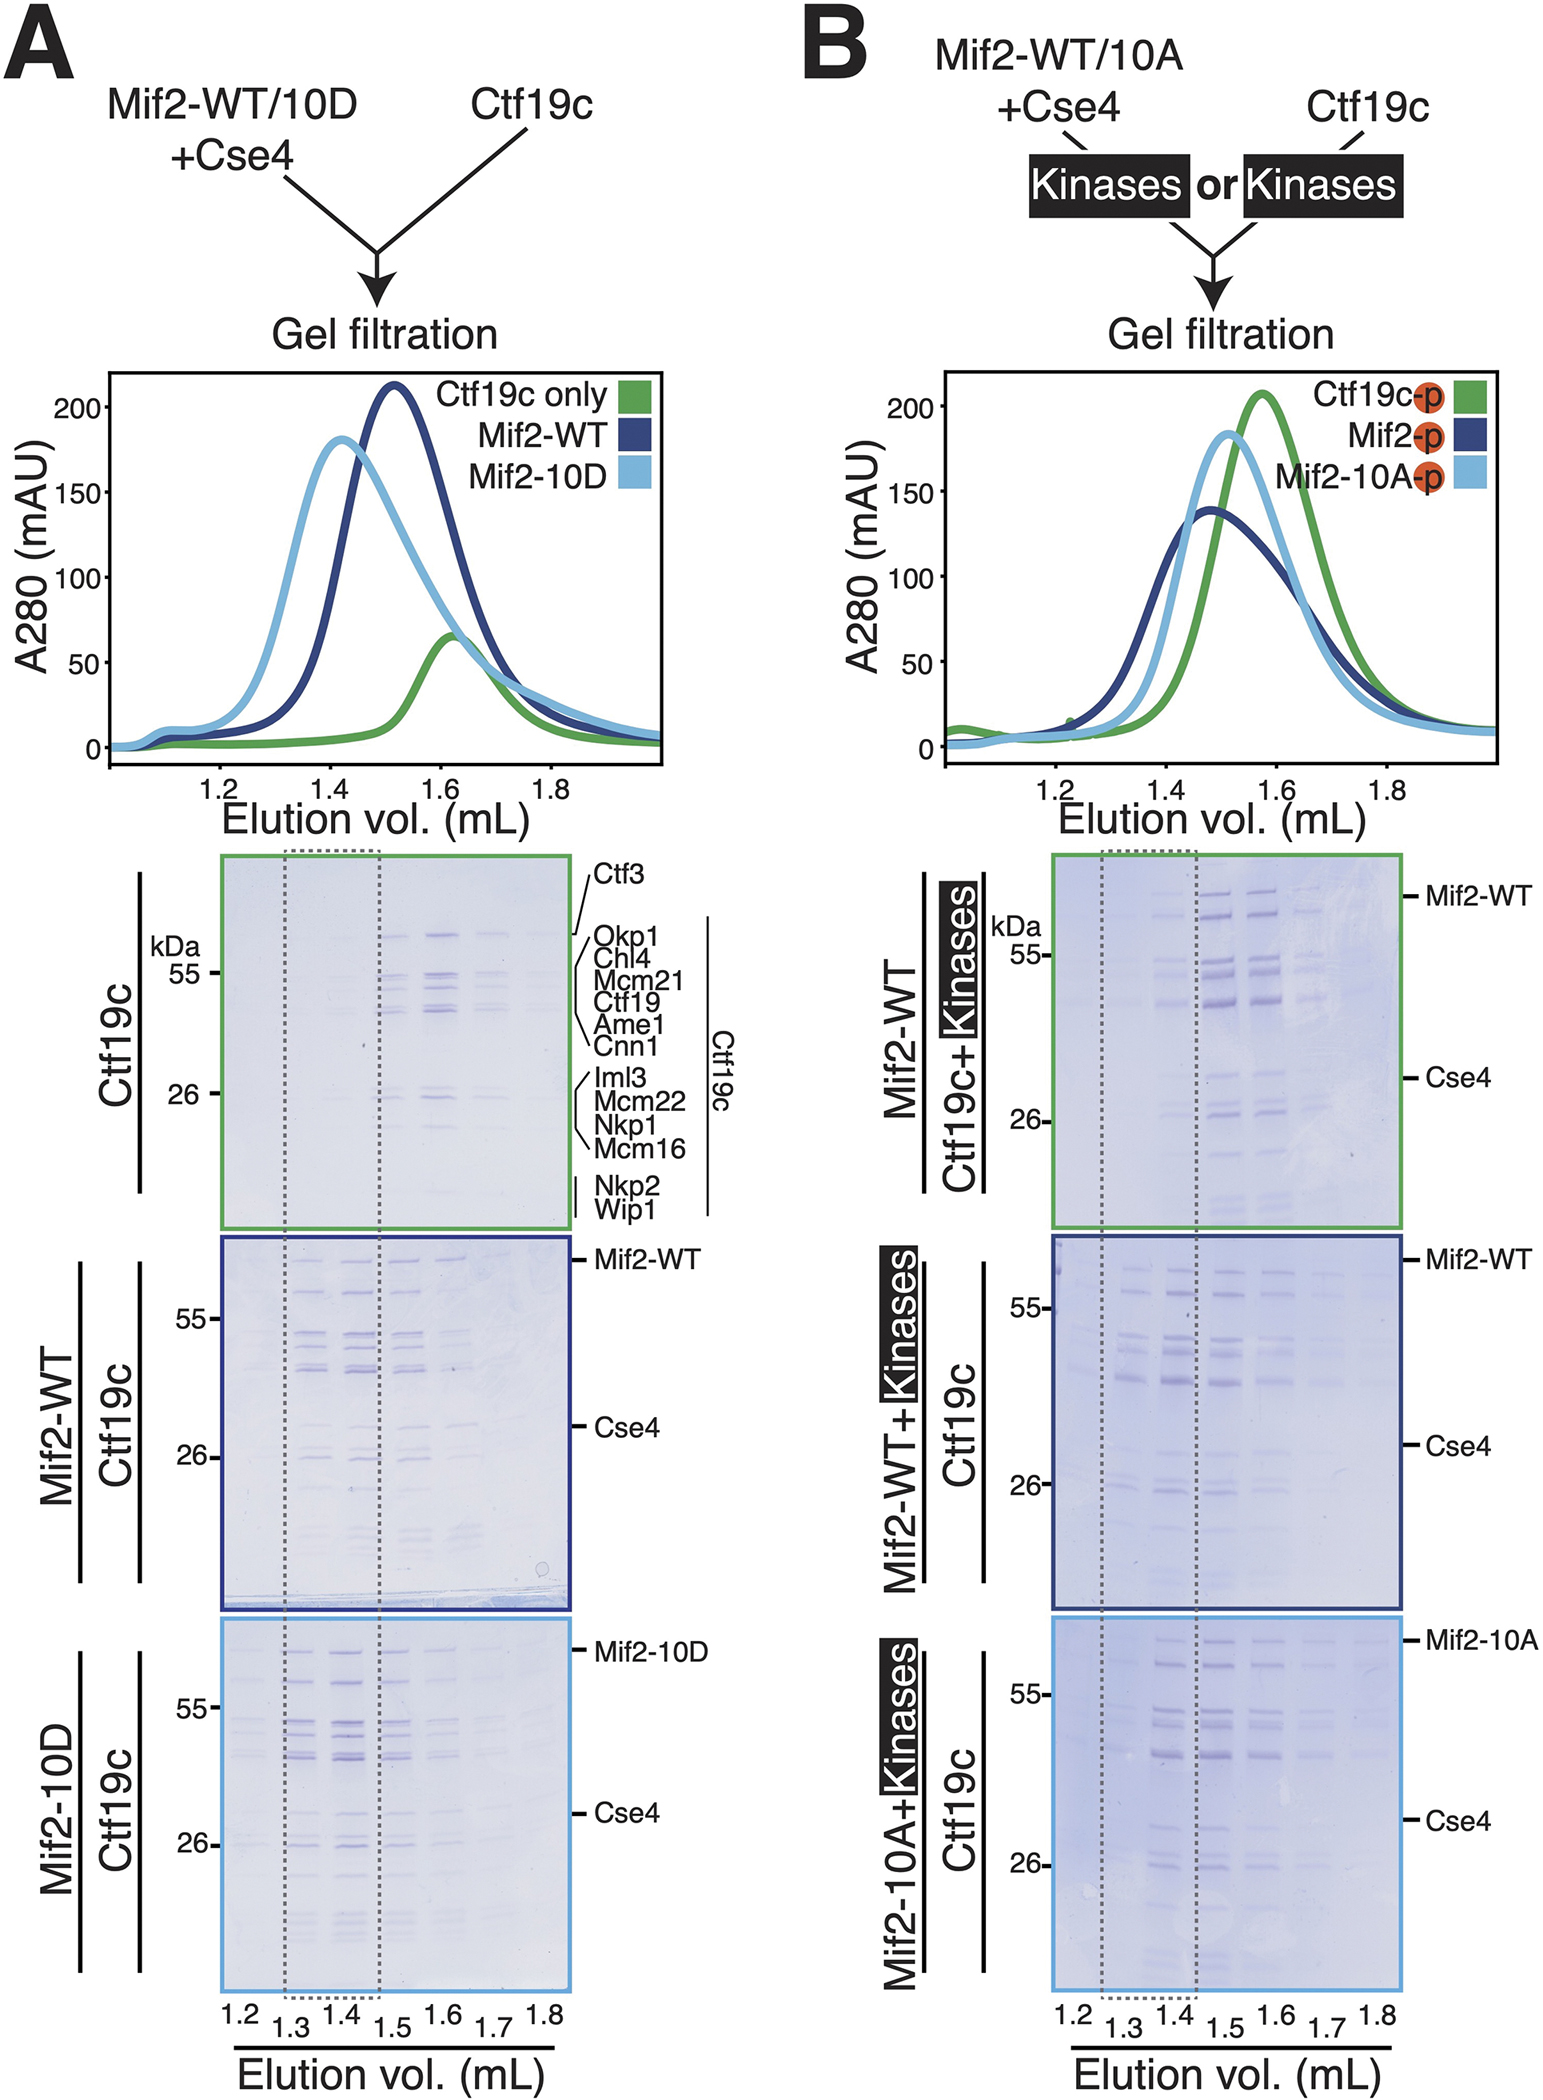
Figure 3 – Biochemical reconstitution of inner kinetochore assembly.

(A) Analysis of inner kinetochore assembly in the absence of kinase activity. The diagram shows the experimental setup. Chromatograms show the gel filtration elution profiles for the indicated samples. The dotted outline is a visual aid to highlight equivalent fractions for each experiment. The curves show the following: green – Ctf19c only; dark blue – Mif2-WT, Cse4 nucleosome, and Ctf19c; light blue – Mif2-10D, Cse4 nucleosome, and Ctf19c. (B) Mif2-Cse4 nucleosome or the Ctf19c was phosphorylated before complex formation and gel filtration. The diagram shows the experimental setup (top). The curves show the following: green – Mif2-Cse4 nucleosome complex with phosphorylated Ctf19c; dark blue – phosphorylated Mif2-Cse4 nucleosome complex with Ctf19c; light blue – phosphorylated Mif2-10A-Cse4 nucleosome complex with Ctf19c. See also Figure S3 and Table S1.
