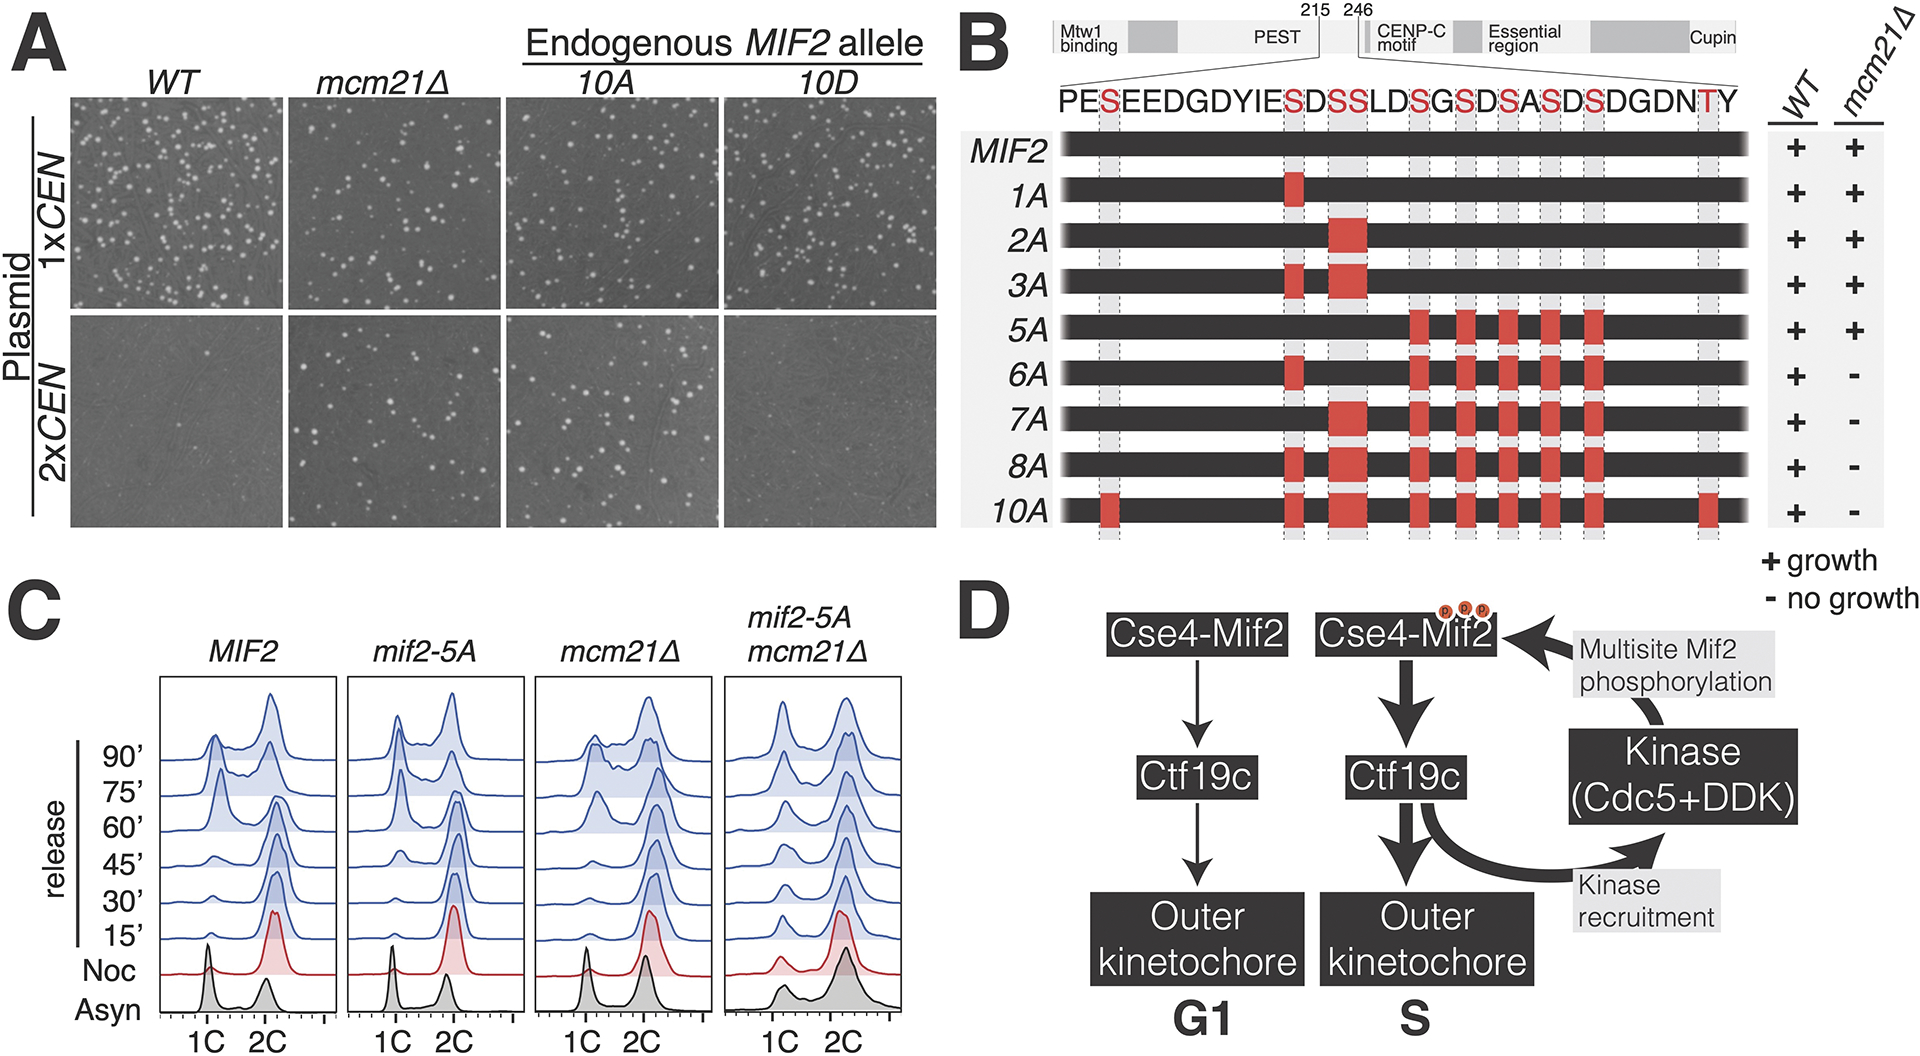
Figure 5 – Genetic analysis of Mif2-PEST phosphorylation sites.

(A) The indicated strains were propagated with a monocentric or dicentric plasmid (1xCEN and 2xCEN, respectively). Viability was assessed by colony formation under selection for the plasmid. Plate images are shown. (B) Diagram showing Mif2 residues 215–246. Alanine mutations corresponding to the indicated MIF2 alleles are shown as red boxes. Viability of the corresponding genotypes was determined by sporulation analysis. The results are summarized at right. See also Figure S5. (C) Recovery from mitotic arrest was analyzed by flow cytometry in the indicated strains. Cells were arrested in G2/M before release into fresh medium. In MIF2 cells, the reappearance (60 minutes) and subsequent disappearance (90 minutes) of the 1C peak shows synchronous cell cycle progression. (D) Model showing kinase regulation of inner kinetochore assembly. Cdc5 and DDK are listed as the likely kinases, and other kinases may contribute at this step (Cdc28/CDK1) 44. Cdc5 and DDK are recruited by inner kinetochore proteins at the G1/S transition 33,34, and this stabilizes inner kinetochore assembly via phosphorylation of Mif2 and possibly other targets. See also Tables S1–2.
