
Fig. 2.
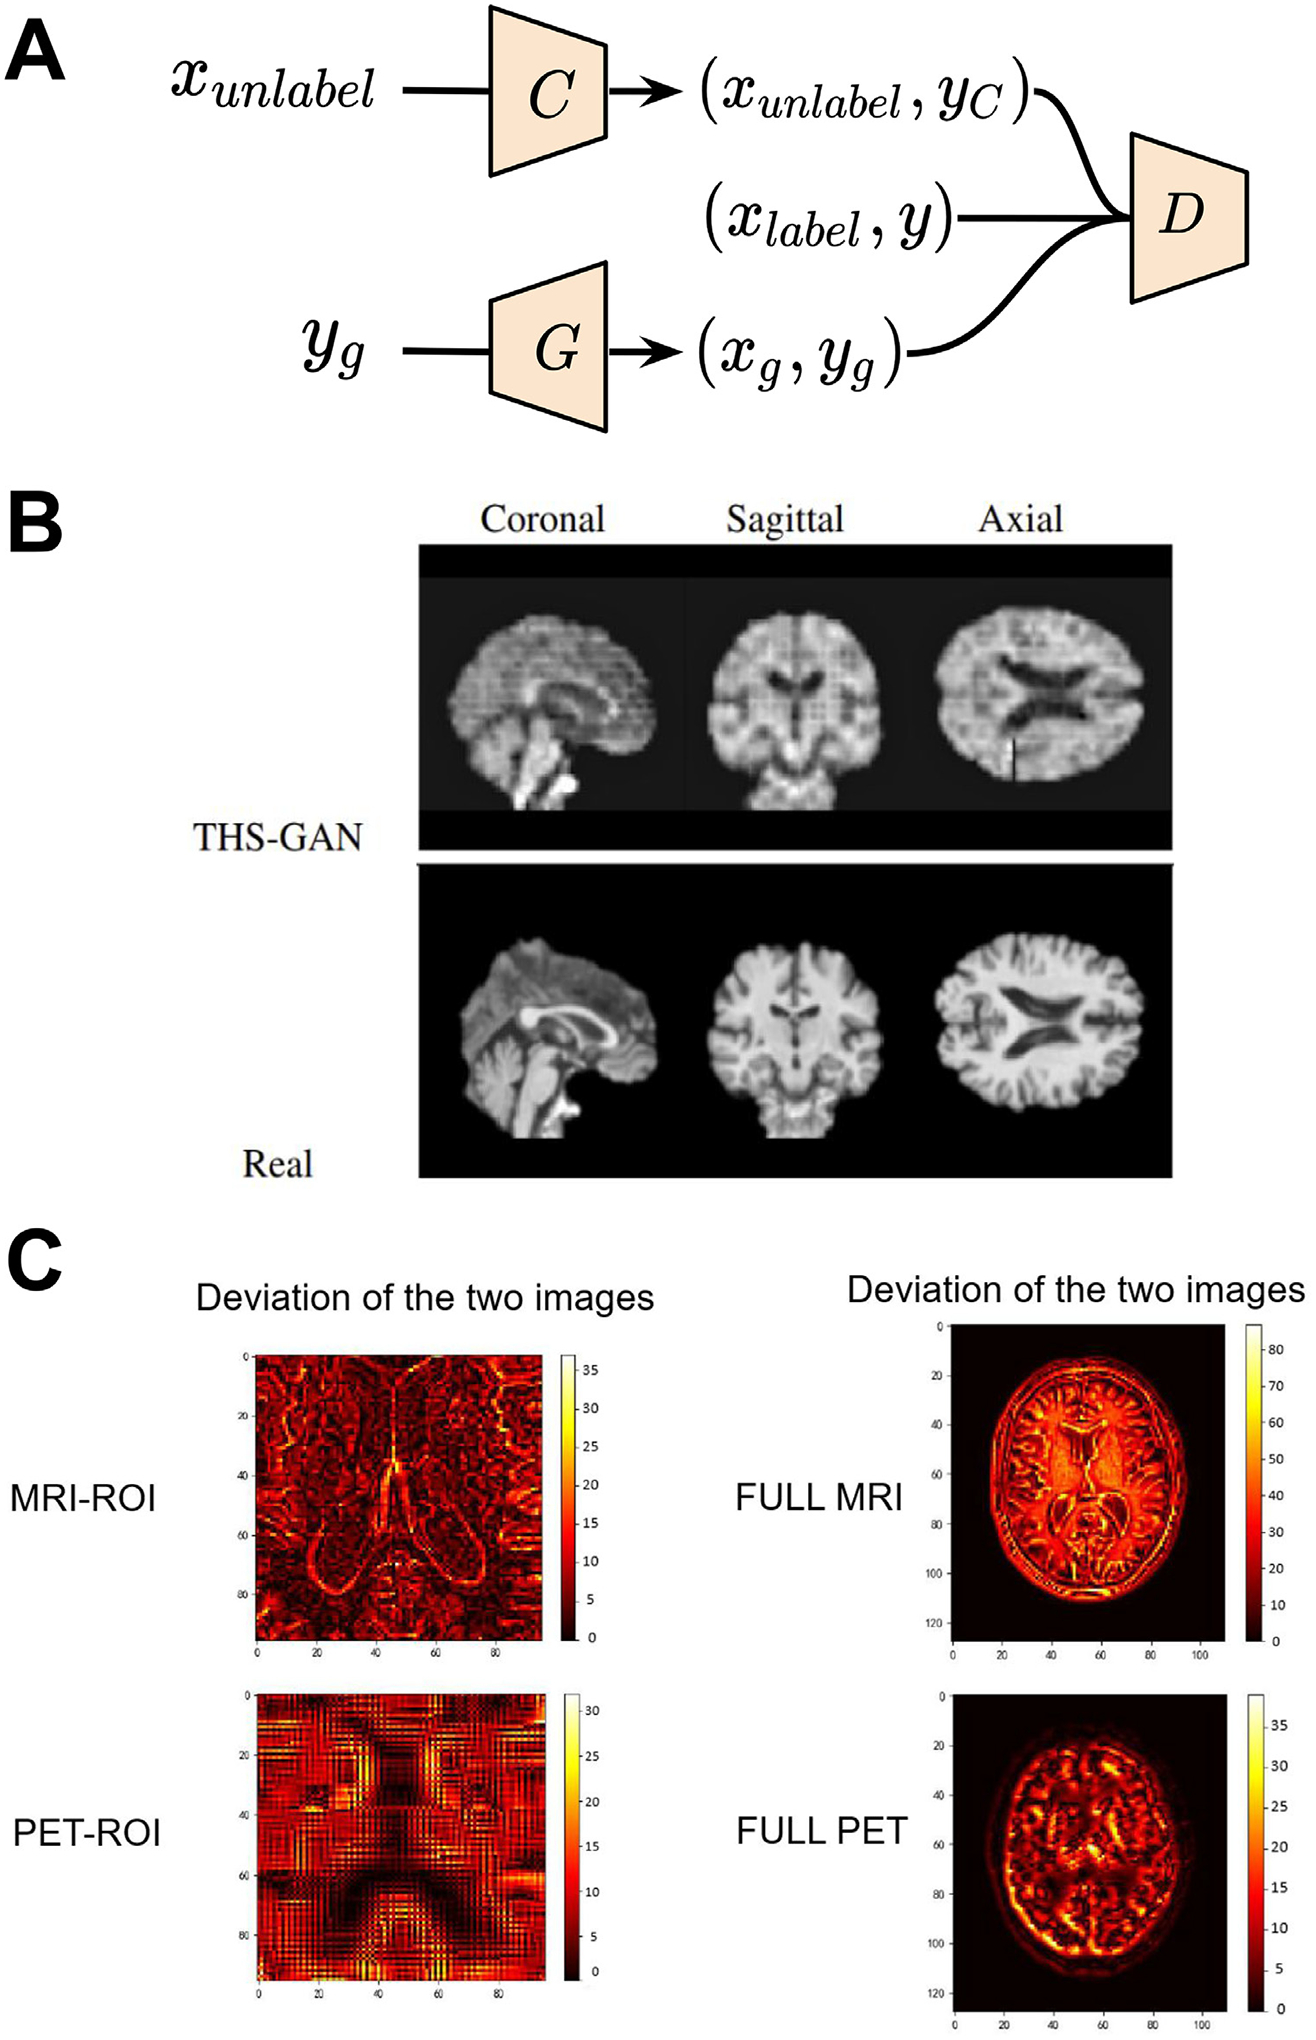
GAN applications in disease classification with single- and multi-modal imaging. (A) Schematic of THS-GAN for Alzheimer’s disease and mild cognitive impairment classifications. (B) Comparison of synthesized brain MR images from THS-GAN and real T1-weighted scans with coronal, sagittal, and axial views for different training epochs. (C) Deviation between real image and synthetic images generated by Rev-GAN. In the deviation image, the yellow color represents large differences, and the dark colors denote small deviations. Images are taken and adapted from Lin et al. (2021), Yu et al. (2021).