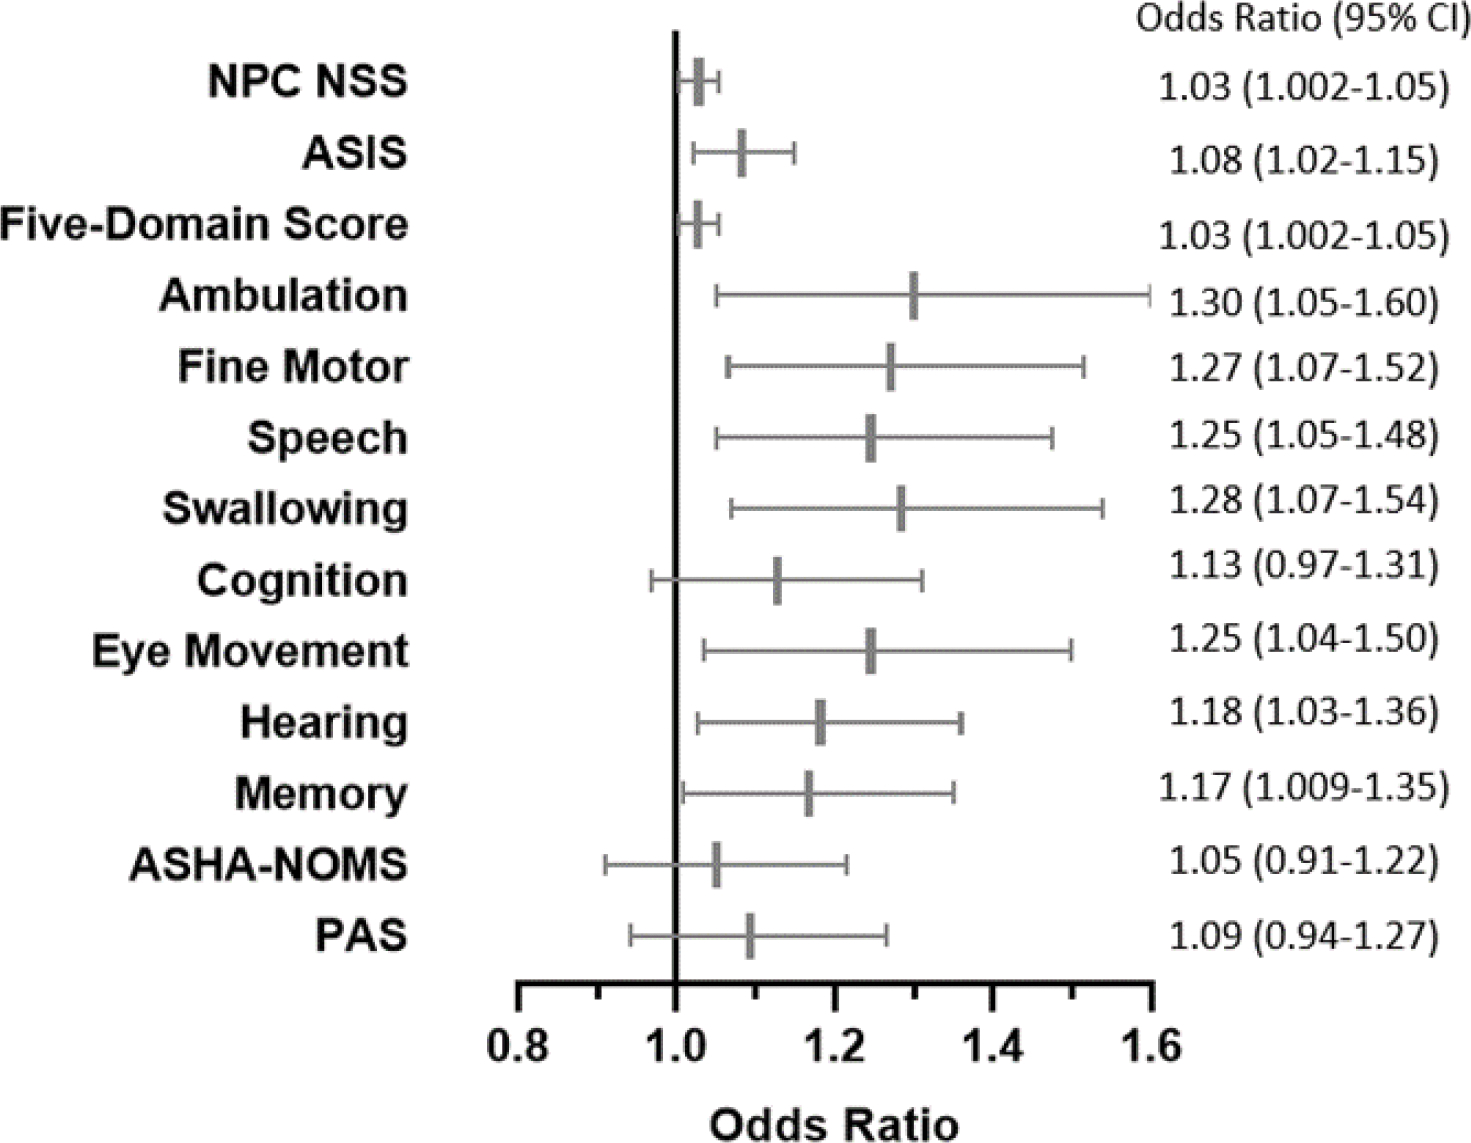
Figure 3: Higher NfL levels over time are associated with increased risk of more severe disease as measured using a variety of outcome measurement tools in longitudinal analysis.

Odds Ratio (OR) and 95% Confidence Intervals (CI) are shown in a forest plot and table. For meaningful clinical interpretation, the ORs are per pg/L units of elevated NfL, adjusted for covariates in final reduced models.
