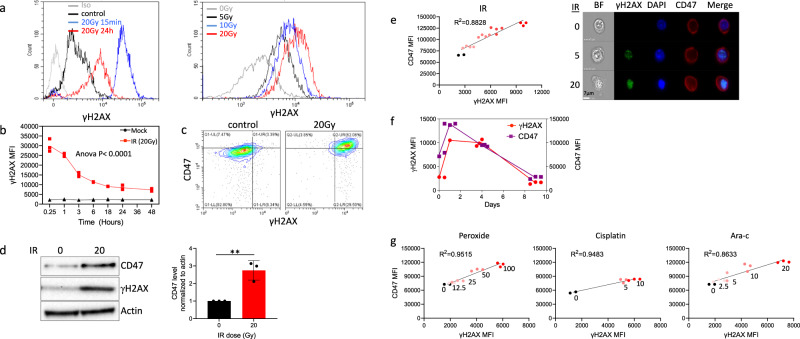
Fig. 3. CD47 expression correlates with the level of γH2AX in response to treatment with genotoxic agents.
a Representative histograms of γH2AX staining before and after γ-irradiation. b Time-dependent expression of γH2AX (MFI) following γ-irradiation (20 Gy). c Representative dot plot of γH2AX and CD47 co-staining before and after γ-irradiation. d Cells were treated as above and after 24 h lysed. Western blot analyses were performed on whole cell extracts using antibodies to CD47 and γH2AX. Anti-β-actin immunoblotting revealed relative amounts of protein in each lane. Graph on the right shows an average (±STD) level of CD47 expression in triplicate samples normalized to actin in each sample (right panels). e The level of CD47 expression in response to γ-irradiation correlates with the level of residual γH2AX (left panel), and representative pictures taken by ImageStream of cells co-stained for CD47 and γH2AX before (0) and after γ-irradiation (5 and 20 Gy). f Graph depicts CD47 expression and γH2AX level (MFI) in HEK-293T cells 1,4 and 9 days after γ-irradiation. g The level of CD47 expression in response to different genotoxic agents correlates with the level of residual γH2AX. Graph shows an average (±STD) of four replicates in each group. One of at least three independent experiments is shown.

