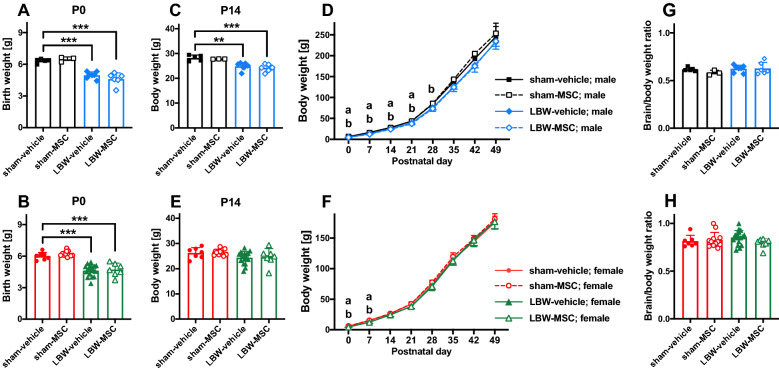
Figure 2.
Body weight. Birth weights of male (A) and female (B) pups. Body weight at P14 of male (C) and female (E) pups. Overall temporal changes, from P0 to P49, in males (D) and females (F). Ratio of brain weight to body weight at the time of perfusion-fixation, i.e., at P56, in males (G) and females (H). In the male group: sham-vehicle (n = 5), sham-MSC (n = 3), LBW-vehicle (n = 7), and LBW-MSC (n = 6). In the female group: sham-vehicle (n = 7), sham-MSC (n = 12), LBW-vehicle (n = 17), and LBW-MSC (n = 7). **p < 0.01, ***p < 0.001. a: p < 0.05, mice in the sham-vehicle vs. LBW-vehicle groups. b: p < 0.05, mice in the sham-vehicle vs. LBW-MSC groups. Mean ± standard deviation. LBW, low birth weight; MSC, mesenchymal stromal cell; P0, postnatal day 0 (the day of birth); P14, postnatal day 14.

