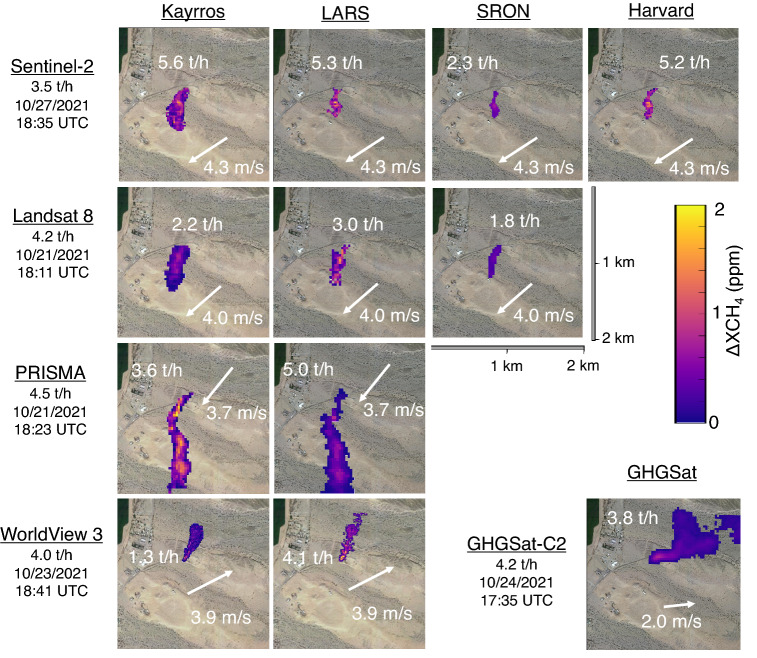
Figure 2.
Visualization of detected emissions for all satellite-team combinations for mean metered release values in the 4 t/h approximate range (3.6–4.5 t/h). The true measured emissions rate and timestamp are given below satellite name. Mean estimated volume from each team/satellite pair, as well as measured 1-min average 10 m wind speed and direction, are superimposed on the corresponding picture. Note that measured time trends in wind speed and direction can cause irregular plume shapes, e.g. for PRISMA and GHGSat-C2, which are also cut off in these images due to plume length. See the SI, Section S7 for full plume images. Surface imagery
© 2021 Google Earth.

