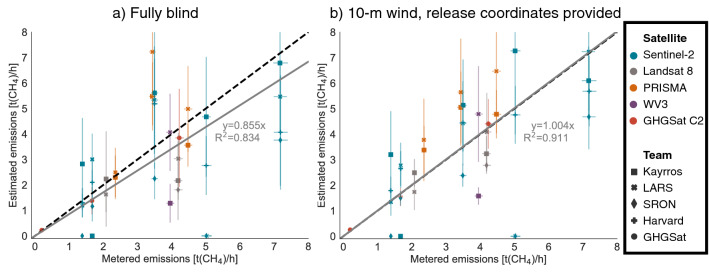
Figure 3.
Quantification performance of methane emissions estimates by satellite and team. Metered emissions compared with single-blind estimates for each overpass with successfully reported data, with 1-sigma X and Y error bars. (a) Fully blind stage 1 results using modeled wind speed estimates. (b) Stage 2 results using 10-m wind speed and direction measurements and the point source location of the plume. Percent error in both cases is similar to aircraft-based methane remote sensing methods. The grey solid line is a linear fit with the intercept fixed at zero, with slope and uncentered R2 displayed. The black dashed lines denote exact 1:1 agreement.

