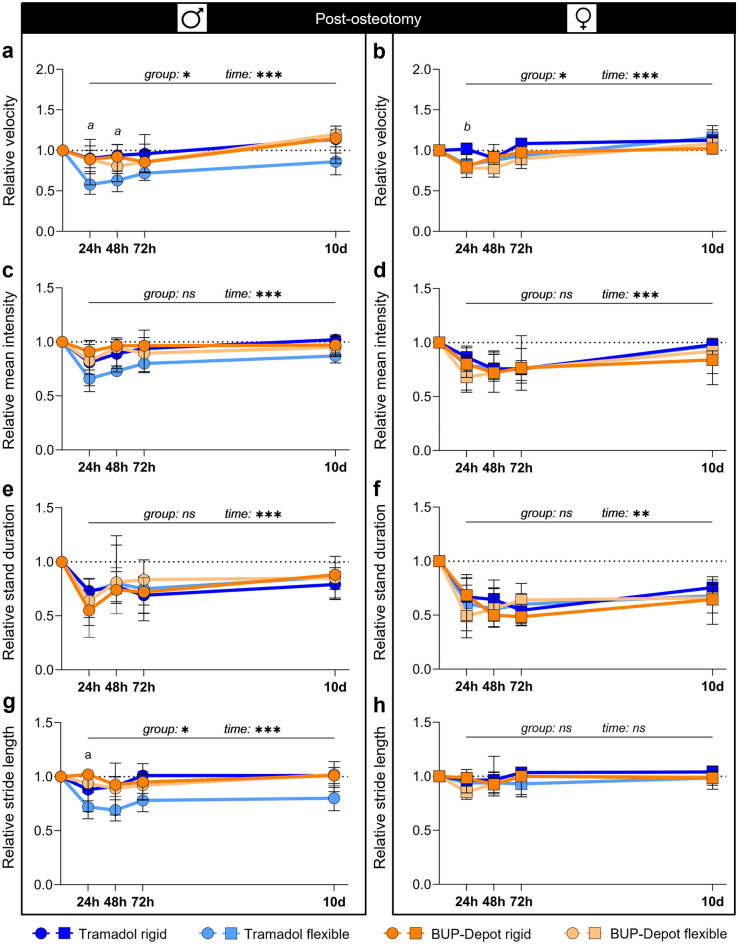
Figure 5.
Gait analyses show model-related alterations in walking behavior specifically pronounced in male mice with flexible fixation and Tramadol treatment. CatWalk analysis was conducted at 24 h, 48 h, 72 h and 10 days post-osteotomy and normalized to the initial mean baseline value focusing on (a,b) relative velocity, (c,d) relative mean intensity, (e,f) relative stand duration and (g,h) relative stride length. All graphs show median with interquartile range for n = 8–10. Non-parametric ANOVA-type test—main effects of time and of group are represented in the graphs; exact p-values are listed in Table S7–S10.2; *p < 0.05, ***p < 0.001. To determine group differences Kruskal–Wallis test and Dunn’s post hoc test with Bonferroni correction were performed. (a) Significant difference Tramadol flexible vs. BUP-Depot rigid; (b) significant difference Tramadol rigid vs. BUP-Depot flexible.

