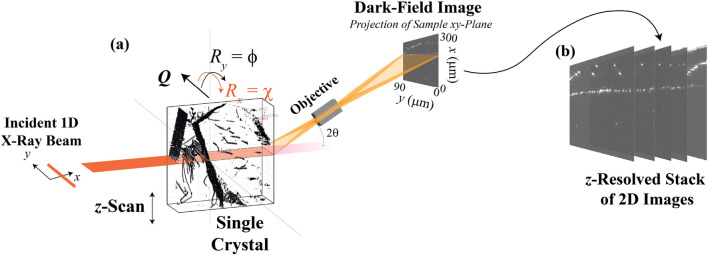
Figure 1.
Schematic showing the DFXM experiment and how it captures each image in our 3D reconstruction, as plotted in the laboratory coordinate system. This study focuses on dislocation structures observed by diffraction contrast from the (002) Bragg reflection, with a corresponding diffraction angle of . To obtain 3D information, DFXM images were collected for 2D layers using a line-focused beam ( (FWHM) in the y and z directions), scanning the sample in the vertical direction, z, to resolve variation along the height of the crystal (as shown in Fig. 1a). The observation plane for each image shown by the orange plane that slices through the cube showing the dislocations we observed in our single crystal. The direction of the scattering vector can be varied by the two tilts, and . The length of the scattering vector can be varied by a combined scan. The figure is made using the MATLAB code in the link https://github.com/leoradm/Dislocation3DAnalysis.git.

