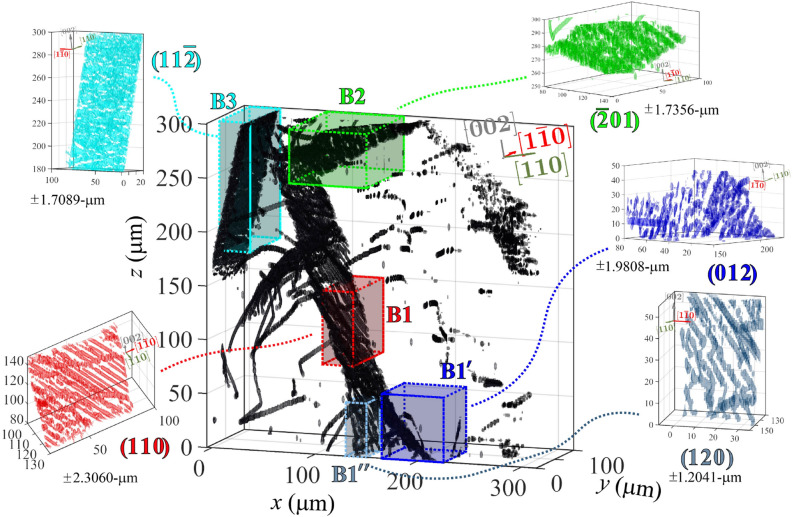
Figure 4.
Labels showing the five primary dislocation structures shown in Fig. 3, each labeled and outlined in a different color. Shown as inlets are zoom-ins on each boundary to demonstrate its orientation, and demonstrate with the “zoomed-in” view how the single dislocations in that boundary are packed. Mean error values from the MSAC fitting are listed for each plane in the respective plots. The figure is made using the MATLAB code in the link https://github.com/leoradm/Dislocation3DAnalysis.git.

