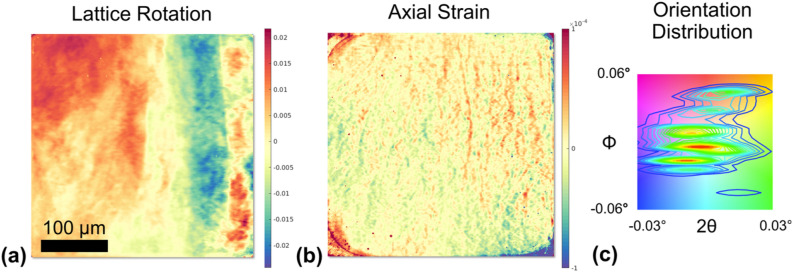
Figure 6.
Computed COM maps of rotation (i.e. rocking curve COM map) (a) and relative axial strain (b) of (002) reflection. The color key shows the angular distribution in the scanned range around the local intensity maxima for the respective axes (c). These maps show the projections from a volume illuminated by box-shaped beam having a size of , rather than a line focused beam (See Supp. Mat. for more details). The measured strain is rather homogeneous having values below , in spite of the clear boundaries that are visible in the COM map. The figure is made using the MATLAB code in the link https://github.com/leoradm/Dislocation3DAnalysis.git and https://gitlab.esrf.fr/julia.garriga/darfix.

