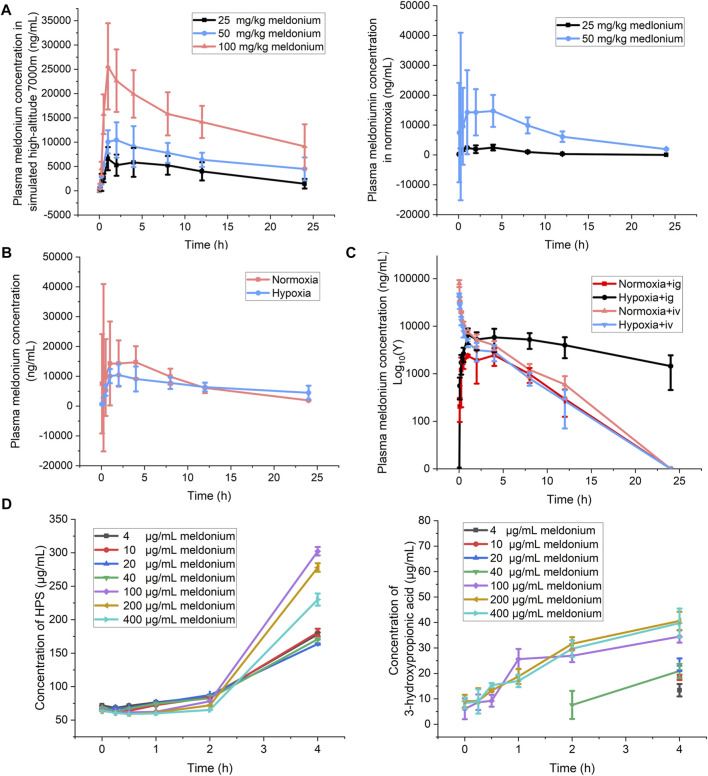
FIGURE 5.
Detection of parameters related to meldonium pharmacokinetics. (A) Drug concentration-time curves of meldonium content in serum after i.,g. administration between normoxia groups (25 and 50 mg/kg) and high-altitude groups (25, 50, and 100 mg/kg, n = 6); (B) Comparison of drug concentration time profiles of meldonium (50 mg/kg) after i.g., administration in high-altitude and normoxia groups (n = 3); (C) Drug concentration-time curves of meldonium (25 mg/kg) after i.v., and i.g., administration between high-altitude and normoxia groups (n = 3); (D) The 3-hydroxypropionic acid and succinic acid content of meldonium after incubation in liver homogenates (n = 3). The data were analyzed using one-way ANOVA analysis of variance with Tukey’s post-tests.

