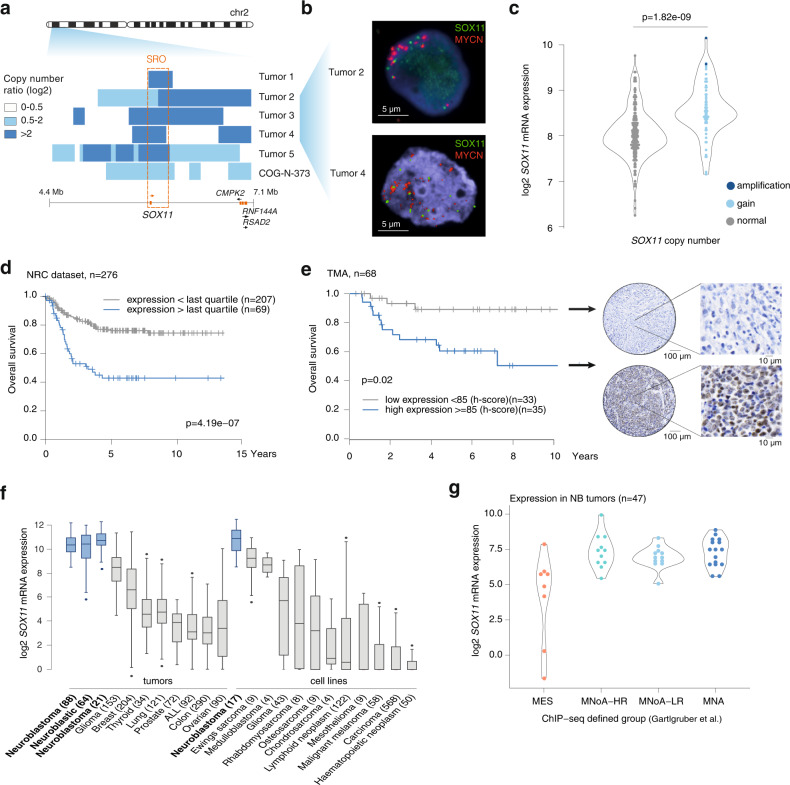
Fig. 1. Rare focal amplifications and lineage-specific expression of SOX11 in NB.
a Log2 copy number ratio on chromosome 2p (4.4–7.1 Mb, hg19) showing shortest region of overlap (SRO) (chr2:5,828,671-6,098,736; hg19) for high-level focal 2p gains (log2ratio > 0.5) and amplification (log2ratio > 2) in 5 NB tumors and 1 NB cell line encompassing the SOX11 locus (GSE10312310). Tumor 1 is evaluated by arrayCGH, tumor 5 by whole genome sequencing, and tumor 2, 3, 4 and the cell line by shallow whole genome sequencing. b FISH analysis performed on two tumor cases with SOX11 amplification from Fig. 1a (asterix) showing independent amplification of SOX11 (green) and MYCN (red). Scalebar represents 5 µm. c SOX11 (log2) mRNA levels according to copy number status (amplification (log2ratio > 2), gain (log2ratio > 0.3); normal) in cohort of 276 patients (NRC cohort, GSE85047)17 (two-tailed T-test, p = 1.82e-09). The samples with SOX11 amplification are tumor 4 and 5 from Fig. 1a. d Kaplan–Meier analysis (overall survival) of 276 neuroblastoma patients (NRC cohort, GSE85047)17 with high (69) or low (207) SOX11 (log2) expression (highest quartile cut-off) (p = 4.19e-07, Kaplan–Meier). e Immunohistochemical staining for SOX11 on tissue micro-array (TMA) of 68 NB tumors52 and correlation of high (35) or low (33) SOX11 protein levels (median cut-off of H-score = 85, see Methods) with overall worse survival (p = 0.02, Kaplan–Meier). For each group, a representative immunohistochemical staining is depicted. Scalebar represents 10 µm. f SOX11 expression (log2) in NB tumors and cell lines (blue) compared to other entities (details see DATA availability). Boxplots show 1st quartile to 3rd quartile and median. Whiskers represent outer two quartiles maximized at 1.5 times the size of the box. If values outside of the whiskers are present, this is indicated with a single dot. Indicated in brackets are number of replicates per entity. g. SOX11 (log2) expression in four H3K27ac profiling based groups identified in NB tumors: MYCN-amplified (MNA), high-risk MYCN non-amplified (MNoA-HR), low-risk MYCN non-amplified group (MNoA-LR) and mesenchymal (MES). SOX11 is higher expressed in MNoA-HR, MNoA-LR and MNA groups as compared to MES group (ANOVA and two-tailed post-tukey test, significant comparisons: MNoA-HR vs MES p = 4e-04, MNoA-LR vs MES p = 2e-03, MNA vs MES p = 2e-04) (GSE136209)14. For Fig. 1c–g, source data are provided as Source Data file.

