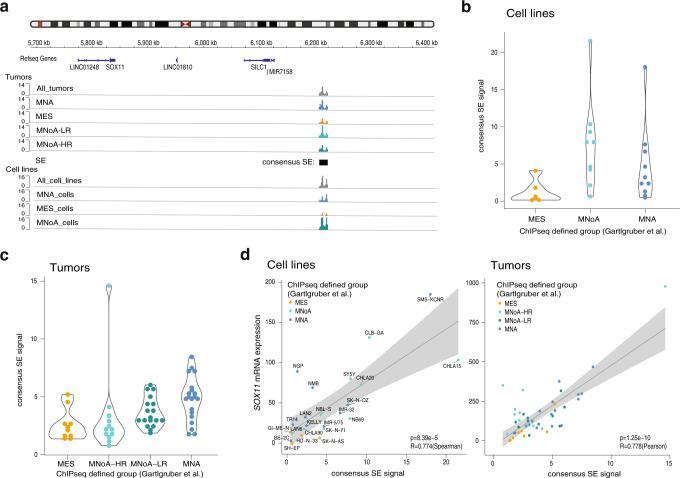
Fig. 2. SOX11 is flanked by multiple cis-interacting adrenergic specific enhancers.
a Super-enhancer calling (present in at least 2 samples and not overlapping with H3K4me3 5 kb from transcription start site) downstream of the SOX11 locus in NB tumors (MNA = adrenergic MYCN amplified, MES = mesenchymal, MNoA-LR = adrenergic MYCN non-amplified low-risk, MNoA-HR = adrenergic MYCN non-amplified high-risk) and NB cell lines (MNA = adrenergic MYCN amplified, MES = mesenchymal, MNoA = adrenergic MYCN non-amplified) (GSE136209)14. b Violin plot showing super-enhancer signal for each individual NB cell line colored by their ChIP-seq signature defined subgroup (GSE136209)14. c Violin plot showing super-enhancer signal for each individual NB tumors colored by their ChIP-seq signature defined subgroup (GSE136209)14. d (Left) Correlation of SOX11 expression with super-enhancer signal of the consensus super-enhancer in a dataset of 25 NB cell lines, colored by their ChIP-seq signature defined subgroup (p-value = 8.39e-5, R-value = 0.774, two-tailed Spearman correlation). (Right) Correlation of SOX11 expression with super-enhancer signal of the consensus super-enhancer in a dataset of 47 NB tumors, colored by their ChIP-seq signature defined subgroup (p-value = 1.25e-10, R-value = 0.778, two-tailed Pearson correlation) (GSE136209)14. Trend line is shown with 95% confidence interval. For Fig. 2b–d, source data are provided as Source Data file.

