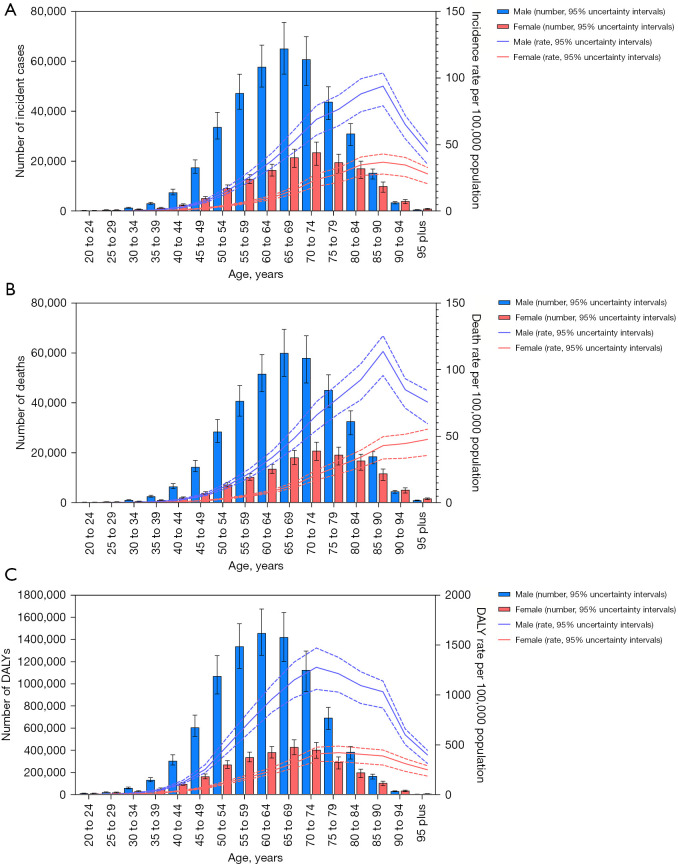
Figure 5.
Global number and age-standardized rates of incidence (A), deaths (B), and DALYs (C) of esophageal cancer by age and sex, 2019. The box plots indicate numbers and line plots indicate rates per 100,000 population. Dashed lines indicate 95% upper and lower uncertainty intervals. DALY, disability-adjusted life-year.

