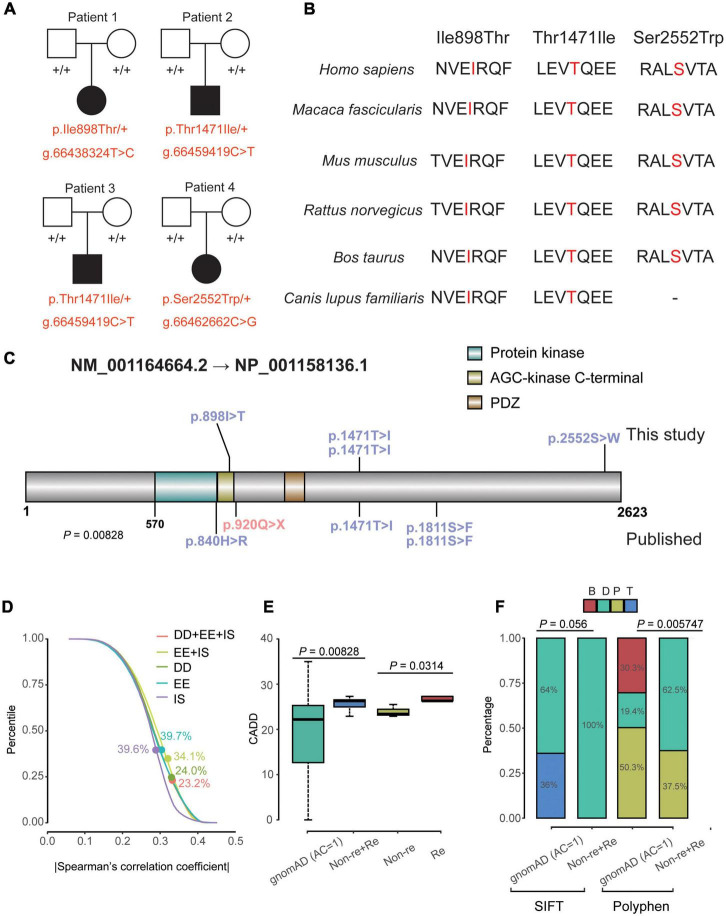
FIGURE 1.
Clinical data and genetics of variants in MAST4. (A) Pedigree plot of the four unrelated families in this research. All affected probands (patient 1–4) are children of unaffected parents. Solid squares and solid circles represent affected males and females, respectively. Hollow squares and hollow circles represent unaffected males and females, respectively, +/+ represents a wild type and –/+ (red) represents a heterozygous genotype. (B) Comparison of conservative property of three de novo MAST4 sites among multiple species. (C) Location of the variants in MAST4. Variants in blue and red represent missense and LGD events, respectively. Mutations on and under the MAST4 belong to this study and published researches, respectively. (D) Percentile of |Spearman’s correlation coefficient| of the co-expression for all non-DD + EE + ISs genes vs. DD + EE + ISs genes, all non-DD vs. DD genes, all non- EE genes vs. EE genes and all non- ISs genes vs. ISs genes. Dots represent the percentile of MAST4. (E,F) Comparison of the CADD scores, SIFT bin and Polyphen bin between de novo missense variants (recurrent and non-recurrent) identified in Table 1 and the private missense variants identified in the non-neuro subset of gnomAD. AC, allele count; B, benign; CADD, Combined Annotation Dependent Depletion; D, deleterious; DD, developmental disorder; EE, epileptic encephalopathy; gnomAD, genome aggregation database; IS, infantile spasm; P, possibly damaging; SIFT, sortig intolerant from tolerant; T, Tolerant.

