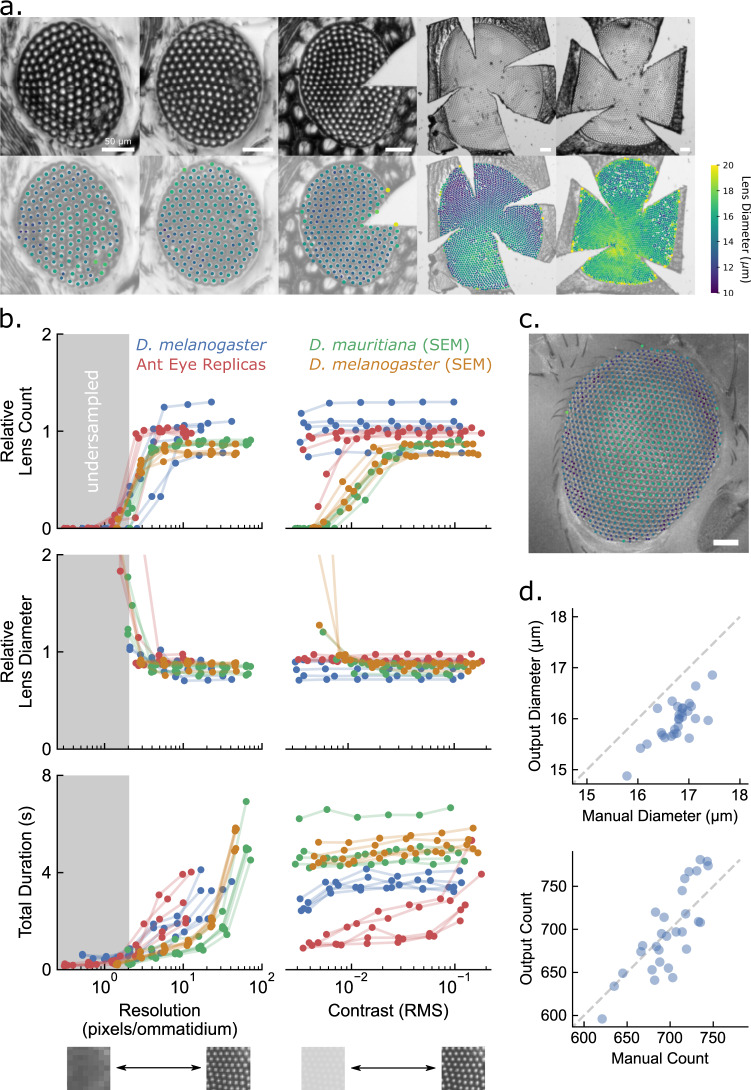
Fig. 2. The ODA successfully approximated ommatidial counts and diameters when compared to manual measurements.
a Micrographs of ant eye molds (top) and their corresponding ODA results (bottom) with approximate lens centers colored according to their diameter. When applied to 5 ant eye molds of 4 species ranging in overall size and lattice regularity, the automated counts were 99% and the diameters were 93% of those measured by hand. For each image, the program missed relatively few ommatidia and the lens diameter measurements were successful even when they varied substantially within an image (as in #4 from the left). Species from left to right: Notoncus ectatommoides, Notoncus ectatommoides, Rhytidoponera inornata, Myrmecia nigrocincta, and Myrmecia tarsata. Scale bars are 50 µm. b Benchmark performance of ODA on micrographs of diminished spatial resolution (left) and contrast (right). We present 3 performance metrics as a function of resolution and contrast: relative lens count equal to the ratio of automatic to manual ommatidia counts (top); relative lens diameter equal to the ratio of automatic to manually measured lens diameters (middle); and the total duration or runtime of the ODA (bottom). c An example fruit fly eye (D. melanogaster) micrograph with the automated ommatidia centers superimposed as points colored according to the measured diameter using the same colormap as in a. d A comparison of automated and manual measurements of lens diameter and count for 29 microscope images of fruit fly eyes from the same species (D. melanogaster). Automated counts were 100% and the diameters were 95% of those measured by hand, with correlations of .81 and .76. Again, there were relatively low rates of false positives and negatives.

