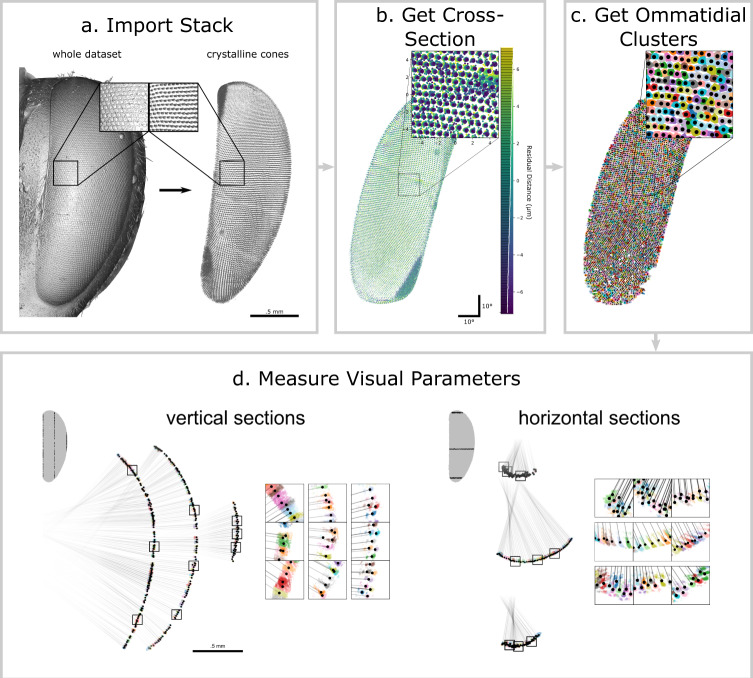
Fig. 6. Checkpoints along ODA-3D for the honeybee scan.
a Import Stack: The pipeline started with an image stack that we pre-filtered and manually cleaned of unrelated structures. b Get Cross-Section: A surface was fitted to the coordinates identifying a cross-section of points within 50% of the residuals. We generated a spherically projected, 2D histogram of the crystalline cone coordinates colored by their residual distance from the cross-section. c Find Ommatidial Clusters: We apply the ODA to label individual crystalline cones. The ODA locates the cluster centers, allowing us to partition the coordinates based on their distance to those centers (boundaries indicated by color-filled polygons). Then we cluster points based on their nearest center and apply our custom clustering algorithm to improve segmentation of more skewed ommatidia. d Measure Visual Parameters: Ommatidial diameter corresponds to the average distance between clusters and their adjacent neighbors. Ommatidial count corresponds to the number of clusters. For non-spherical eyes, we can partition the 3D coordinates into vertical (left) and horizontal (right) cross-sections in order to calculate independent vertical and horizontal anatomical IO angle components accounting for skewness in the ommatidial axes. The insets zoom into regions around the 25th, 50th, and 75th percentile ommatidia along the y-axis (left) and x-axis (right). Note: in c and d the different colors signify different crystalline cone clusters. In d, the black lines follow the ommatidial axes and the black dots indicate the cluster centroids. Also in d, note how some ommatidia in the periphery (for example, horizontal insets row 2, columns 2 and 3) were erroneously segmented and thus underestimate their skewness and IO angles.

