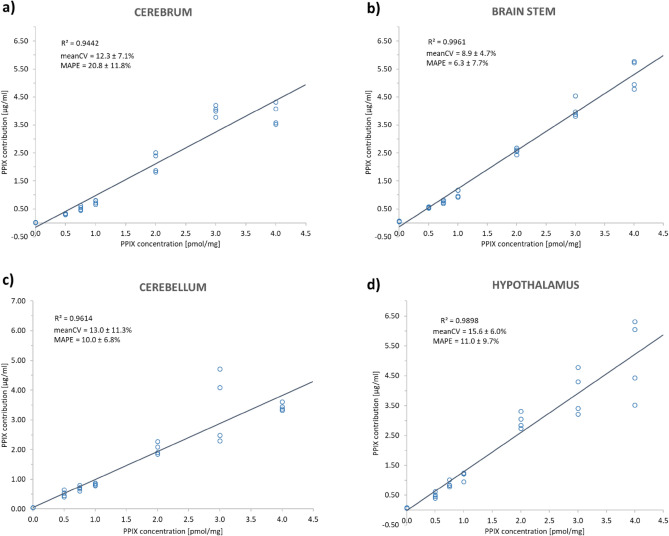
Figure 3.
Results for the correlation of hyperspectrally measured PPIX contributions [µg/ml] with known PPIX concentrations [pmol/mg] in pig brain homogenates (CV = coefficient of variation, MAPE = mean absolute percentage error, mean ± standard deviation). Homogenates were prepared from (a) cerebrum, (b) brain stem, (c) cerebellum and (d) hypothalamus to accommodate variations of tissue optical properties. PPIX was spiked in known concentrations: 0.0, 0.5, 0.75, 1.0, 2.0, 3.0 and 4.0 pmol/mg with n = 4 replicates.

